

Curriculum Director @ CMT Association | Technical Analyst | Portfolio Manager
U.S.A.
- Tweets 1,183
- Following 700
- Followers 1,881
- Likes 21,070


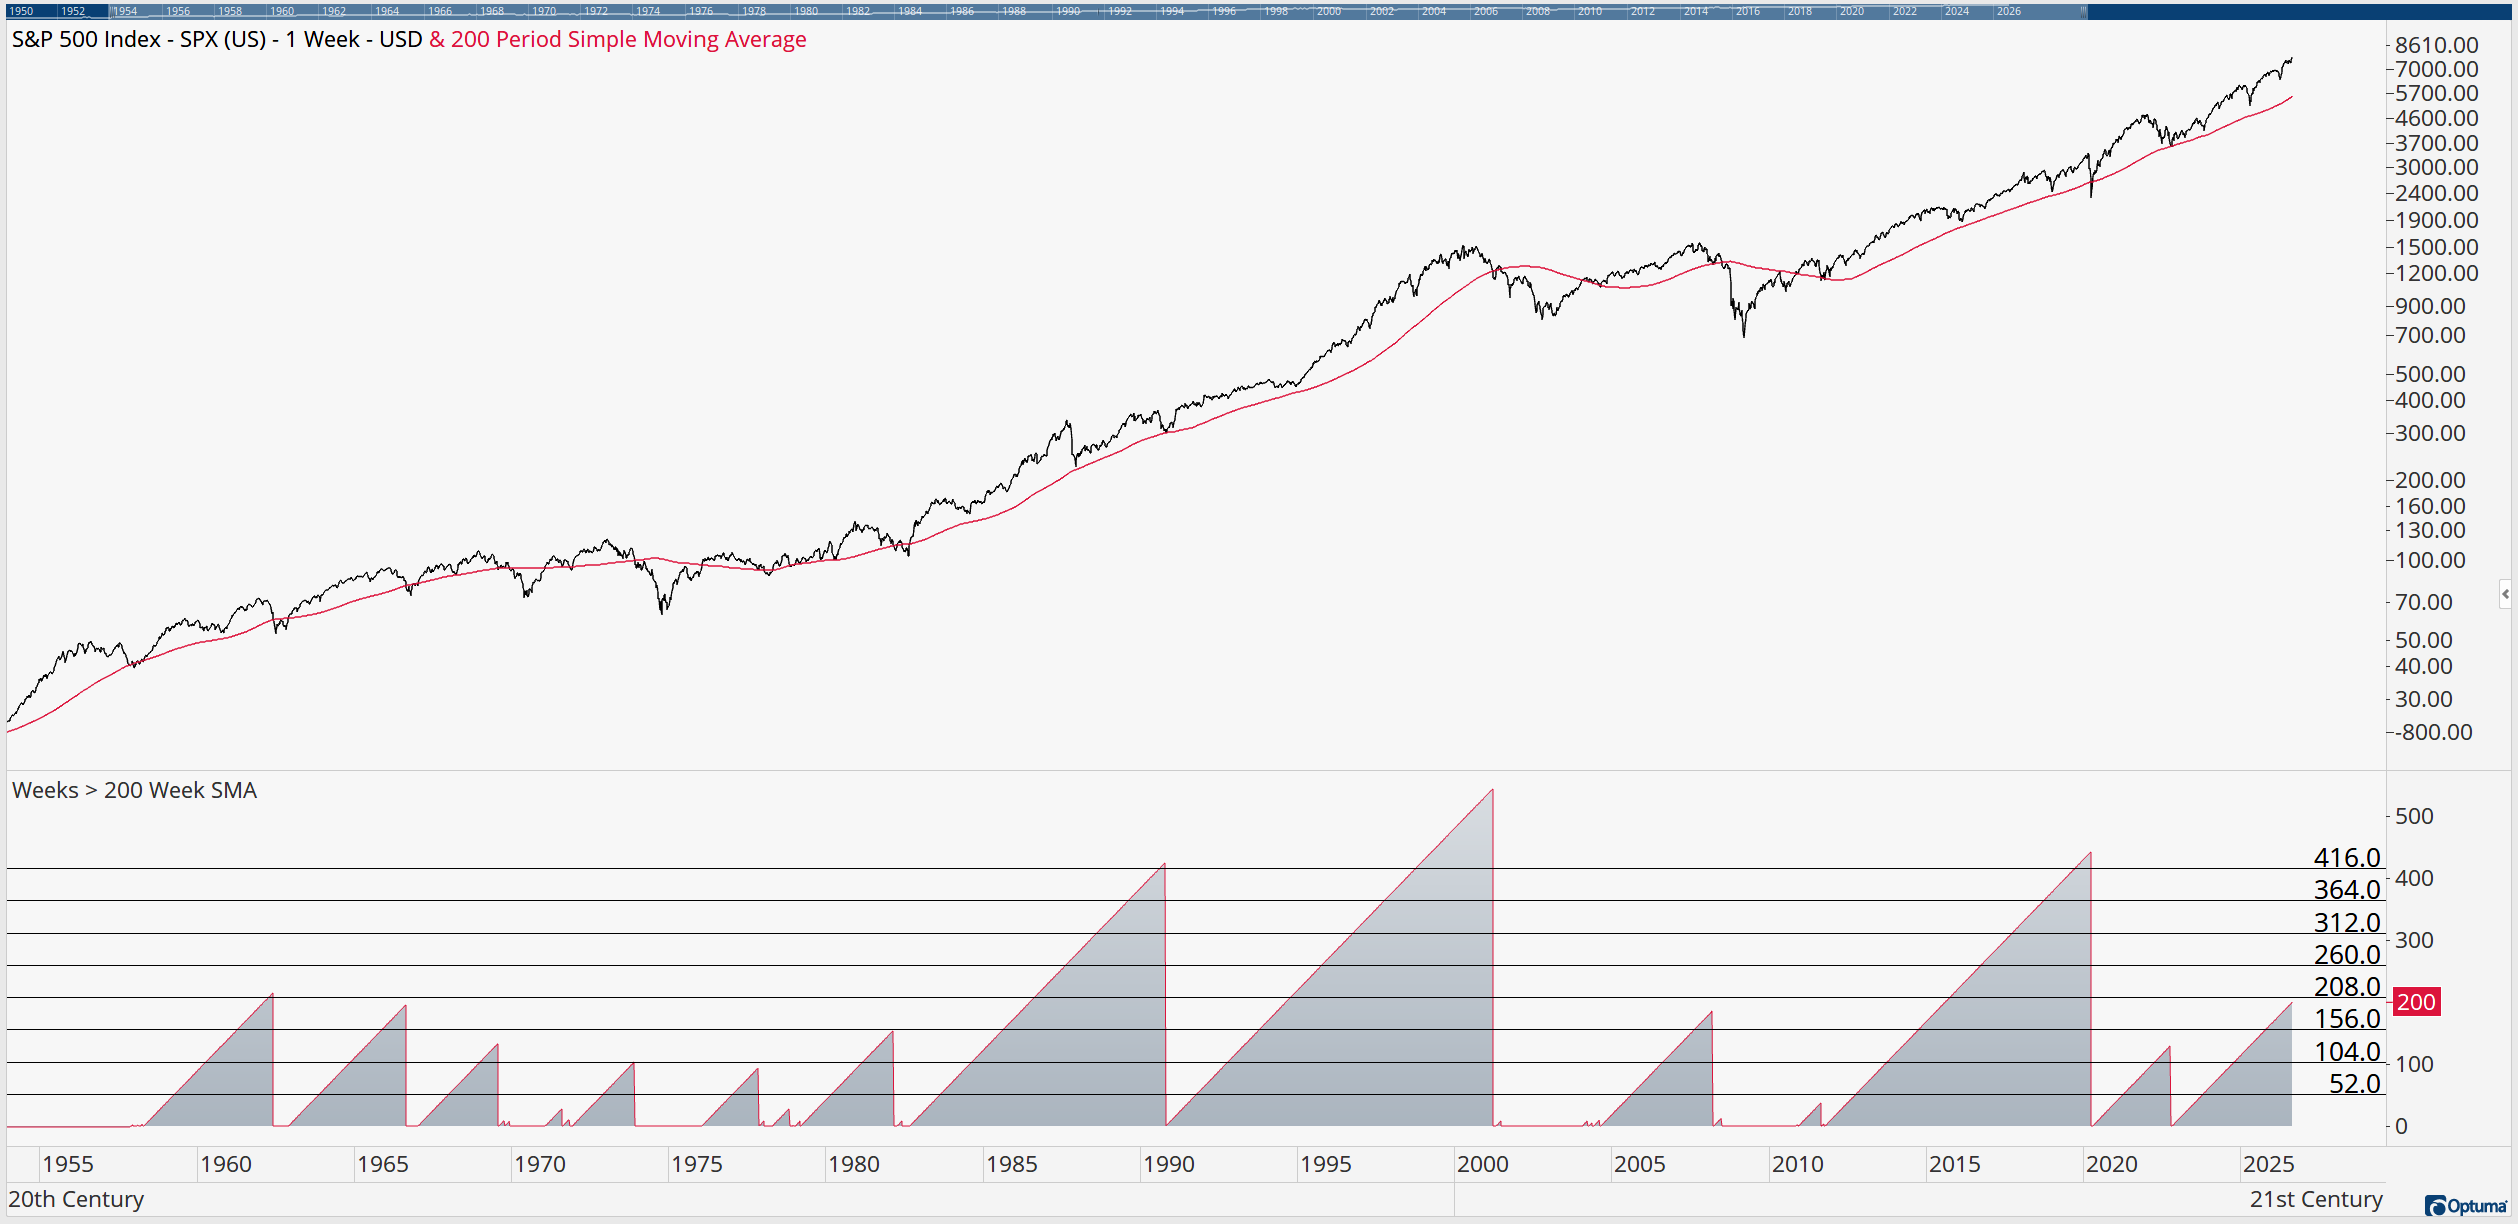
Interestingly, the S&P 500 has closed above its 200-week moving average for 200 consecutive weeks.
2
10
1,656
The current market story: While large caps have stalled in a short-term trading range, the uptrends in mid and small caps remain intact. Viewed through the lens of S&P 1500 stocks above their 200-day moving average, market participation continues to expand.

1
10
397
Thank you @DKellerCMT for teaching technicians the value of scenario analysis.
Inspired by his work, this chart applies a volatility-based framework to map potential S&P 500 outcomes over the next two months.

11
1,380
Another all-time closing high for the Dow Jones Industrial Average. That's the 8th of the year.

5
319

The S&P 500 is <0.5% above its 200-day moving average after 211 days above it.
What happens when runs this long finally break?
Find out here: dropbox.com/scl/fi/julpxt5q8…
redcedarresearch.com

3
5
40
4,412


After 138 trading days, SPX just ended its longest run above the 50-day moving average since the 2009 bottom.

7
446
The VIX futures curve flipped into backwardation. Short-term stress priced above long-term calm.
What matters next:
1) Spot VIX retreats, the storm has passed
2) Longer dated futures drop and front stays high, stress is more persistent
3) Inversion lingers, uncertainty remains

4
3
20
2,484
Our relative sector positioning versus the S&P 500 was unchanged this month. No shifts in overweight, underweight, or zero-weight stances. The model remains overweight XLU, XLK, XLI, XLF, XLC; underweight XLY, XLP, XLB; and out of XLV, XLRE, and XLE.

10
671
In the large-cap space, technology closed last month at a 12-month high in price and relative strength. Also, 12-month price highs from XLI and XLU.
My CedarCore sector model is running overweight: XLC, XLI, XLK, XLF, and XLU.
Underweight or out: XLB, XLE, XLP, XLRE, XLV, XLY.

3
470

The Value Line Geometric Avg. tracks ~1,700 N. American stocks and uses a geometric mean to better reflect broad participation vs. cap-weighted indexes.
Just closed above its 52-wk avg, historically bullish for the S&P 500 since 1975, and is breaking out of a multi-year base.

1
1
8
548
With small caps now above their 200-day moving averages alongside mid and large caps, this marks a constructive development across capitalization tiers. The percentage of S&P 1500 stocks trading above their own 200-day averages is also back above 50%.

1
14
1,606
High yield spreads just slipped below the 200-day. A narrowing spread = rising confidence. Historically, that's a better-than-average bullish backdrop for S&P 500. Worth watching.

2
6
36
6,918
SPX with DMI and RSI. Because of the strength of the move down from mid-Feb to mid-March, the probability favors, at least, a retest of the mid-March low. From there, watching for a positive momentum divergence and rally or a failure...

3
1
16
1,524


