

Our World in Data is a free, nonprofit website with a mission to increase understanding of the world’s largest problems and drive informed action to solve them.
Oxford, England
- Tweets 3,098
- Following 21
- Followers 308,184
- Likes 472


Shortly after the end of the last great ice age — 10,000 years ago — 57% of the world’s habitable land was covered by forest. That’s 6 billion hectares. Today, only 4 billion hectares are left. The world has lost one-third of its forests, an area twice the size of the United States.
Only 10% of this was lost in the first half of this period, until 5,000 years ago. The turn of the 20th century is when global forest loss reached the halfway point: half of total forest loss occurred from 8,000 BCE to 1900; the other half occurred in the last century alone. Deforestation is not a new problem: relatively small populations of the past were capable of driving a large amount of forest loss. But deforestation accelerated over the last century, driven by the continued expansion of land for agriculture. Urban land accounts for just 1% of global habitable land.
The world passed “peak deforestation” in the 1980s, and it has been on the decline since then. Improvements in crop yields mean the per capita demand for agricultural land continues to fall. Since 1961, the amount of land we use for agriculture has increased by only 7%. Meanwhile, the global population has more than doubled, from 3.1 to 8 billion. This means that agricultural land per person has more than halved.
There are real reasons to believe that this century doesn’t have to replicate the destruction of the last one.

8
42
127
7,614
Read the article by @_HannahRitchie: ourworldindata.org/world-los…
1
4
2,333
Electric car sales are growing rapidly in Turkey.
If your job was to sell cars in Turkey in 2022, selling an electric one would be an unusual day at work. Just one new car out of every 100 sales was electric.
By 2025, this had become a fairly normal day. More than one in five new cars were electric — a more than 20-fold increase in just three years. You can see this rapid takeoff in the chart.
Why did electric models become so popular? In 2023, the government introduced tax relief for electric cars, cutting the registration tax compared to petrol and diesel cars. This was timed to coincide with the launch of Turkey’s first domestic electric car manufacturer, Togg, which has quickly become the market leader. Imports of cheaper electric car models, including from China, have also made these markets more diverse and cost-competitive.
This combination of factors has made electric cars far more affordable than they were just a few years ago.
(written by @_HannahRitchie)

9
40
164
10,568
Explore how electric car sales are changing in markets across the world: ourworldindata.org/electric-…
1
7
2,636
How is the world doing on the development goals it set for 2030?
In 2015, every country in the United Nations agreed on the same 17 Sustainable Development Goals for 2030 — among them, ending extreme poverty everywhere, getting every girl and boy through primary and secondary school, and bringing safe drinking water to every household. The UN tracks progress on all 17 in one place, the SDG Indicators Database.
The UN collects the numbers from the agency responsible for each subject — the World Health Organization for health, the International Labour Organization for work, etc. — then publishes them against definitions every country has agreed to. A household counts as living in a slum, for instance, if it lacks any one of five things: improved water, sanitation, enough living space, durable housing, and secure tenure.
The framework covers 234 indicators across 274 countries and territories, and some series reach back to the 1960s. We publish this data in our SDG Tracker, which has a page for each of the 17 goals. We have refreshed it with the latest release, which updated 261 of our charts, covering everything from hunger and schooling to water, work, cities, and oceans.
(This data update was led by Tuna Acisu and Mojmír Vinkler.)

5
13
72
13,590
Explore the data behind all 17 goals in our SDG Tracker: ourworldindata.org/sdgs
1
1
4
2,666
After a decade of growth, Indonesia has become the world's largest producer of processed nickel.
We are all surrounded by nickel. It’s one of the key ingredients in stainless steel, so most of us see it every day: from the pots we cook with, to the pipes in bathrooms, the batteries in mobile phones, and alloys in cars.
For nearly four decades, Indonesia — which has the world’s largest reserves — mined nickel but processed very little of it at home. This changed around a decade ago, when the government banned the export of raw nickel, forcing companies to process it domestically.
That’s the focus of the chart, which shows processed nickel production in tonnes among today’s largest producers.
Indonesia’s production increased more than 60-fold, going from around 22,000 tonnes in 2014 to over 1.4 million tonnes in 2023. The country went from producing 1% of the world’s total processed nickel to 41% in that period.
In 2021, Indonesia overtook China to become the world’s largest producer and is now far ahead. But much of that growth involved Chinese capital. The International Energy Agency reports that Chinese companies now own the vast majority of Indonesia’s nickel refining assets.
(written by @EOrtizOspina)

5
122
378
41,622
Read more about which countries have the critical minerals needed for the energy transition: ourworldindata.org/countries…
Other sources & data:
ourworldindata.org/explorers…
usitc.gov/publications/332/w…
iea.blob.core.windows.net/as…
1
4
3,956
📝 New article on Our World in Data: How high is current immigration to the United States, in historical perspective?
Ask Americans about the top concerns for the United States, and immigration is rarely far from the top of the list. It’s a topic that dominates election cycles and divides public opinion.
That raises a broader historical question: how high are current immigration levels compared to what the United States has experienced before?
This article looks at Census Bureau data stretching back to 1850 to explore that question. We first look at what the data captures, then explore how the number of immigrants and their share of the US population have changed over time.
The data shows that, as is often the case, the answer depends on what you’re comparing and how far back in time you go.
If we look at the total number of people born elsewhere who are now living in the US, this number is genuinely unprecedented. In 2024, 50 million immigrants were living there, up from 10 million in 1970.
But the US population has grown over that time, too. If we look at the share of the US population born elsewhere, the rate is not historically unprecedented. Around 15% of the population was foreign-born in 2024, similar to the figure in the late 19th century.
Of course, migration patterns have changed substantially in other ways. One example is where immigrants were born. We also look at this data in our article.

4
4
31
9,264
Beef production has been the largest driver of deforestation this century.
Over the last two decades, around 128 million hectares of forest have been cleared to make way for agriculture and forest plantations. That’s an area five times the size of the United Kingdom.
What has driven this deforestation?
A recent paper estimated the contribution of different agricultural products over the last few decades. In the chart, you can see the breakdown.
Beef production has been the largest driver by far, contributing over 40% of the total. This has mostly been the clearing of forest for grazing pasture, especially across Brazil and other countries in Latin America.
Oilseeds — mostly soy and oil palm — were the second-largest driver, again concentrated in Latin America for soy and in Indonesia and Malaysia for palm oil. While deforestation for palm oil was high in the early 2000s and 2010s, it has fallen a lot in recent years.
Forest plantations have been a large driver of deforestation in North America and East Asia. Deforestation for most other products — including cereals, roots and tubers, and cash crops like cocoa and coffee — has been concentrated in Africa, where yields have not grown quickly enough to offset rising demand.
(written by @_HannahRitchie)

30
376
732
54,369
Read more in Hannah's recent article on this topic, with breakdowns by region: ourworldindata.org/what-has-…
Other sources & data:
nature.com/articles/s43016-0…
ourworldindata.org/grapher/d…
1
10
3,919
Since the rise of humans, wild land mammal biomass has declined by 85%.
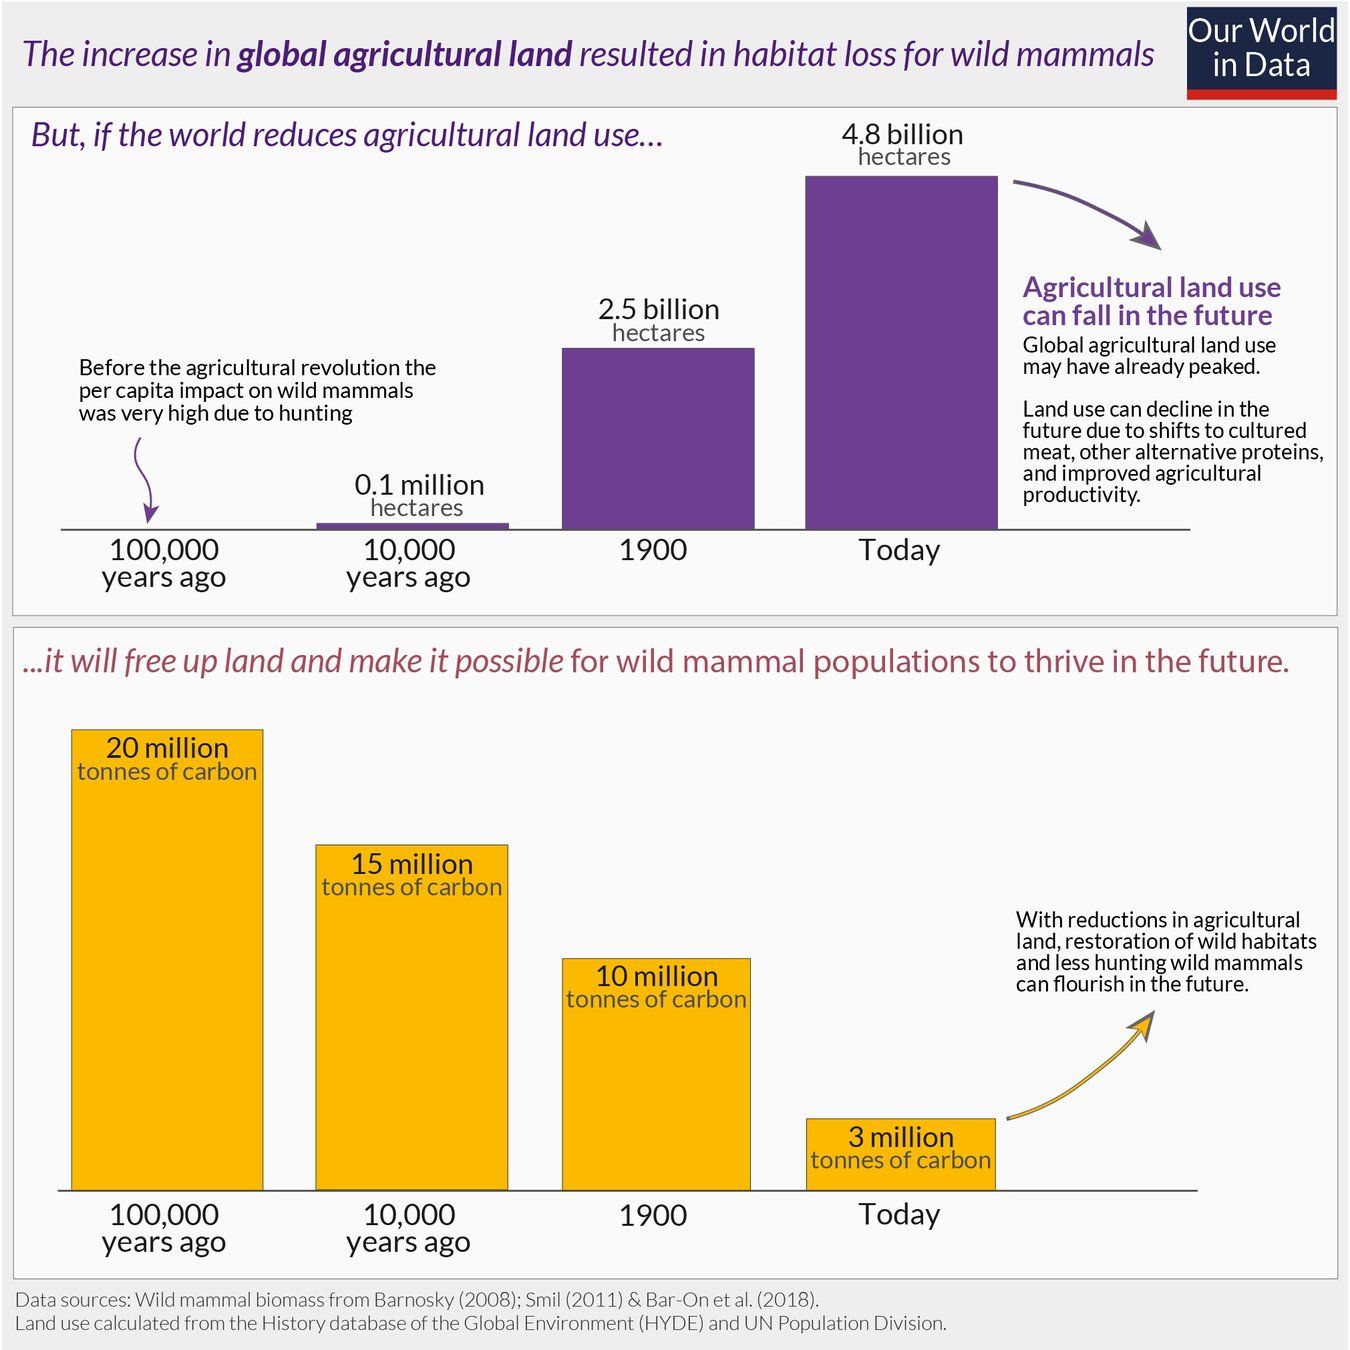
Around 100,000 years ago, all of the wild land mammals on Earth summed up to around 20 million tonnes of carbon. By around 10,000 years ago, there had been a huge decline, likely in the range of 25% to 50%. It was almost exclusively the world’s largest mammals that vanished, in what is referred to as the Quaternary Megafauna Extinction. Most evidence now points towards humans being a key driver, mostly through hunting, even though there were likely fewer than five million people in the world at the time.
By 1900, wild mammals had seen another large decline, but the pressures had shifted. The rise of agriculture alleviated some of the direct pressure from hunting, but the need for agricultural land meant the loss of wild habitats. Wild mammals saw another large decline in the last century, while the human population increased, and livestock even more so.
With only around three million tonnes of wild land mammal biomass left, a return to wild hunting is not an option at any larger scale: if the world relied on wild mammals for the livestock meat it consumes, they would all be eaten within a month. But the alternative of continued growth in livestock consumption is also not sustainable.
If we can reduce agricultural land — and primarily land use for livestock — we can free up land for wild mammals to return. Agricultural land per person has more than halved since 1960, and global agricultural land has declined slightly since 2000. Plant-based diets and alternative meat products could help, but the biggest barriers will be scale and affordability.
5
34
88
9,978
Read the article by @_HannahRitchie: ourworldindata.org/wild-mamm…
1
4
2,812
Haiti and the Dominican Republic share the last Caribbean island with endemic malaria.
Malaria was once endemic across much of the Caribbean. This map shows how much progress has been made: the islands in green are all malaria-free.
Some of these islands were certified by the WHO to have eliminated the disease decades ago. This requires, among other things, zero indigenous cases for three consecutive years. The list includes Grenada and Saint Lucia in 1962, Trinidad and Tobago in 1965, Dominica and Jamaica in 1966, and Cuba in 1973.
Others are on the WHO’s list of countries where malaria never existed, and those where it disappeared without a deliberate anti-malaria campaign.
At the center, you can see Haiti and the Dominican Republic, which share the island of Hispaniola. They are the Caribbean’s last island countries with endemic malaria.
The Dominican Republic is much closer to elimination — it reported around 1,200 locally acquired cases in 2024, compared with almost 38,600 in Haiti. But its success depends on Haiti’s too, because malaria doesn’t stop at the border. This is why malaria eradication needs coordinated efforts across countries.
(written by @EOrtizOspina)

2
9
34
9,893
Read more about the history of malaria, and how the world can continue to make progress against it: ourworldindata.org/malaria
Other sources & data:
who.int/teams/global-malaria…
who.int/publications/i/item/…
2
2
2,877
How fast is the world building up solar power?
The International Renewable Energy Agency (IRENA) is an intergovernmental organization with 172 countries and the European Union. Its Renewable Energy Statistics is a reference dataset on how much renewable power capacity has been installed around the world.
IRENA gathers the figures each year from national statistical offices, energy ministries, and industry associations, and fills gaps from official reports. The data covers almost every country from 2000 to 2025, broken down by technology: solar, wind, hydropower, bioenergy, geothermal, and others.
The chart shows the total solar capacity installed in each country, in gigawatts. Note that the figures are cumulative: they count every panel still in operation, not only those added in a given year.
The world added more than 500 gigawatts of solar in 2025 alone — more than twice all the solar capacity that existed anywhere in 2015. China alone accounts for half of the world’s cumulative total, with 1,200 gigawatts.
Our principal data scientist Pablo Rosado recently updated our charts with IRENA’s July 2026 release, which adds data for 2025. In the same pass, he updated two other IRENA datasets we rely on: the cost of electricity from renewable plants, and patents in renewable energy technologies.

31
100
452
159,370
Explore all of the updated data in our interactive charts: ourworldindata.org/search?da…
3
13
5,247
Around one-fifth of adults in the world use tobacco. But large gaps often exist in smoking rates between genders.
Globally, more than one-third of men use tobacco, while less than one in ten women do.
Men are more likely to use tobacco in almost every country in the world. You can see this on the chart, which plots the share of men (on the vertical axis) versus the share of women (on the horizontal axis). Nearly all countries lie above the diagonal line, which means more men do so.
This data is collated and published by the World Health Organization. It’s based on adults aged 15 years and older and includes all tobacco products. In most countries, smoking is the main form of tobacco use, but in some, smokeless or chewing tobacco is more common.
(written by @_HannahRitchie and @parriagadap)

6
16
57
10,338
Explore all of our data and research on smoking across the world: ourworldindata.org/smoking
Other sources & data:
ourworldindata.org/grapher/s…
1
2
2,860