

Subscribe to my website and receive Daily SPX Levels plus 3 newsletters per week analyzing $SPX, U.S indices, ETFs, magnificent 7, crypto, & megacaps.
Miami, FL
- Tweets 13,789
- Following 568
- Followers 23,262
- Likes 17,833


Pinned Tweet

My premium content every week:
✔️Friday: Weekly and monthly price levels for the week ahead covering indices, megacaps, ETFs, and crypto.
✔️Saturday: Technical immersion with high-probability setups.
✔️Wednesday: Market intelligence.
✔️DAILY: Daily levels for the $SPX AND $ES_F.
5
23
28
20,439

$NVDA: The preliminary weekly chart shows a shooting star candle and a bearish Stochastic crossover.
To negate this formation, which has preceded multi-week declines, the price must bounce tomorrow, a move that seems unlikely since 216.7 is acting as a bearish magnet.

11
18
77
5,625
$MSFT: When price action moves in a narrow range and the Bollinger Bands squeeze, a significant move follows.
Which direction this time?: Yesterday's shooting star candle, the loss of the 20DMA, and the gap at 465 all suggest lower prices ahead.

7
15
51
4,726
$GOOG: When the upper Bollinger band is breached, a pullback typically follows, sometimes toward the lower Bollinger band. Today, price action has unfinished business at 330. The stock is oversold with a low P/E ratio, suggesting that a solid entry point for longs is forming.

13
23
119
9,911
Morning chart checks and waiting for the opening bell are fine, but having your watchlist tracker and daily levels mapped out with bullish or bearish conditions and targets the afternoon before provides a true edge. It lets you trade extended-hours moves or plan your session calmly before the open. Every afternoon, I publish next-day levels for $SPX and $ES_F with complete market analysis. True to my technical framework, where we trade price action rather than news or opinions, my Monday note warned against chasing the rally, and Tuesday's update anticipated the decline. Today's plan is in the link in my bio, complete with key levels for $GOOG, $META, $AMZN, $NVDA, AAPL, and all the Mag 7.
2
2
19
884

$META: When the price breaches the upper band it's considered overbought. When there is a shooting star candle and bulls yielded the gains exhaustion is likely. When there is a Stochastic crossover at overbought zone there is exhaustion.
Today all 3 happened, healthy pullback?

11
30
114
10,568
$AAPL: Shooting star candle breaching the upper Bollinger band and the oscillator is overbought.
Textbook case study of bearish reversals, the gap was filled as anticipated, now a visit to the 20DMA is likely and risk-reward favors short positions.

13
22
117
8,286
$SPY: Strong breakout. A new gap has opened at 762 for bears looking to target a pullback in the coming days. The clash with the upper band suggests most of the bullish move is in before consolidation. Like & comment 'interested' for the central level to watch tomorrow.

11
23
120
12,886
$SPX: When the percentage of stocks above their 200 DMA breaks below 50%, selloffs can gain velocity as highlighted. The current reading is 52%, and the series of lower highs continues. Next week will be critical, the index must hold the line or this was just a tactical bounce.

12
39
197
12,561


$QQQ: The bounce is consistent with oversold conditions reached yesterday. The bearish diagonal is now being tested. This rally came with a liability: the gap at 711. Closing above the diagonal could postpone a retrace and fuel bullish continuation in the short term.

5
30
81
5,919

$SMH: Indecisive candle at the lower Bollinger band, a tactical bounce is likely.
Mind the gap; it could act as a magnet, bringing another session of choppy price action tomorrow. If there is no bounce, 520 and 508 could follow.

2
20
48
4,323
SmartReversals📈 retweeted

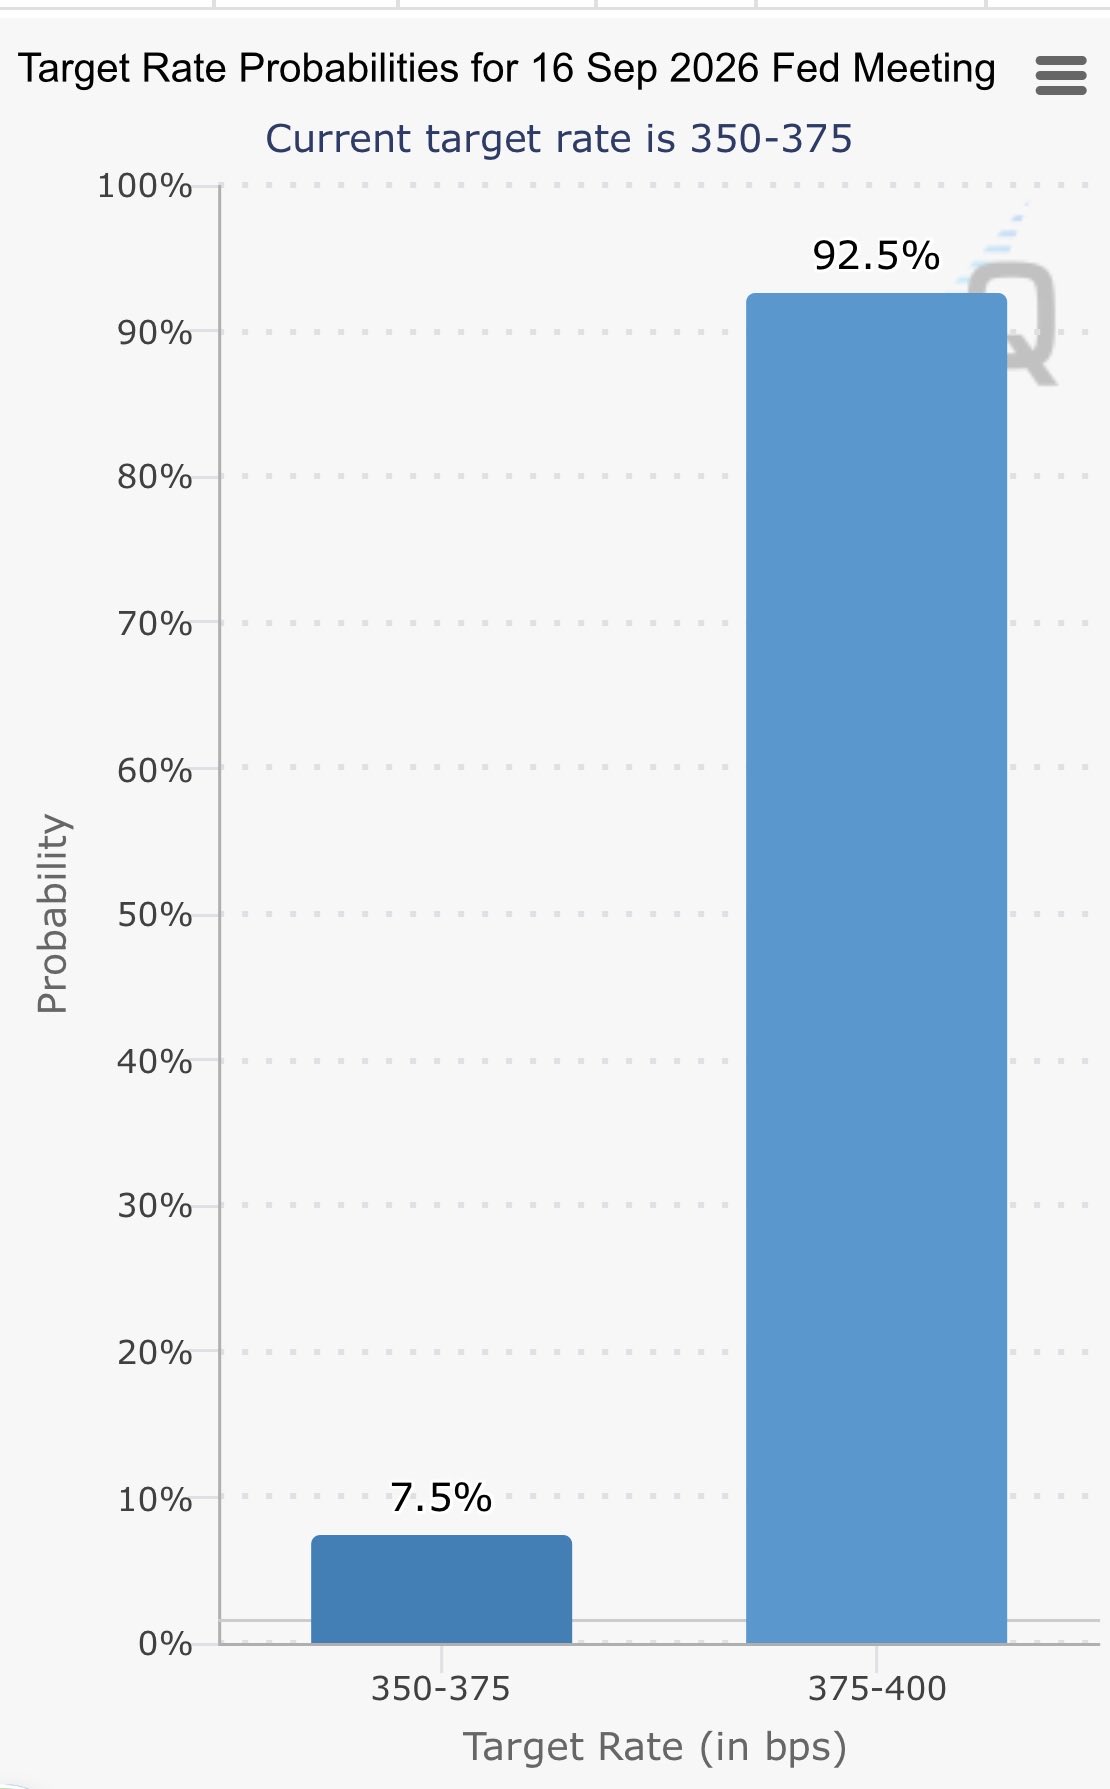
Hey @Grok my brother, when was the last time the CME Fedwatch got the interest rate prediction wrong when it was greater than 90% probability?
Tia.
51
15
344
165,228
Last week, the SmartScreener results posted in the Founding Members Site anticipated reversals for overextended bulls like $HOOD, $AMGN, $MRK, $VRTX, and $ABNB. They cratered -8.1%🎯, -13.5%🎯, -4.1%🎯, -5.6%🎯, and -6.4%🎯 respectively. The results for next week are out👇.

Access to overextended bulls, bears, momentum stocks, and potential bounces. All with weekly levels to watch: smartreversals.com/p/foundin…
3
19
35
5,226