

Market & Portfolio Strategist | Macro, Market Structure & Digital Assets - Founder of 62ndAlpha - Sign up partner.blofin.com/d/62ndAlp…
- Tweets 33,916
- Following 135
- Followers 5,224
- Likes 32,051


$VVV Stomped out of my trade.
Next level I’d trade is a revisit of the 200dSMA, golden pocket and revisit of the local diagonal trend.
The best trades are always marked and planned out in advance with as many levels of confluence as possible.
You win some you lose some 👨🏽💻👀🤓🤷🏽♂️


2
219
Another $SUI announcement 🧨
Accumulating at the literal lows because we understand simple trends
Literally easiest trade of your life and you still said no, Ben Cowen is a bear so I’m a bear.
Fucking retard.😂


🚨ALIBABA CLOUD AI AGENTS CAN NOW PAY ON SUI!
@SuiNetwork and @alibaba_cloud just opened Alibaba Cloud to AI agents.
The agent calls the service, pays per use in stablecoins, and cannot spend past the limit you set.
Announced live at Sui Basecamp.

1
6
57
3,108
🎯TECHNICAL ANALYSIS 101 FOR DUMMIES🎯
$ETH is showing exactly why support/resistance should be treated as zones, not perfect lines.
Look at the sequence:
ETH repeatedly sweeps below support, grabs liquidity, then reclaims the level. Those green circles are essentially failed breakdowns / SFP-style deviations. Sellers get trapped, price re-enters the range, and ETH rotates toward the next major liquidity zone above.
Then resistance does the opposite: price pushes above it, fails to hold, and rotates back down.
The blue circle is especially important; ETH chops around the ~$2,600 area, repeatedly tests both sides, then establishes acceptance above it. What was resistance begins turning into support.
Now we’re sitting around $2,612, right beneath the ~$2,650–$2,675 zone.
My roadmap is simple:
Sweep → reclaim → acceptance → expansion.
If ETH repeats the structure and sweeps beneath this support before reclaiming it, I’m looking for ~$2,675 first, then the major ~$2,775 resistance.
Break and ACCEPT above ~$2,775 and the structure changes dramatically. That opens the door toward $2,850–$2,900 and eventually $3,000+.
The point isn’t predicting every candle.
It’s understanding where liquidity sits and waiting for price to tell you whether the deviation is real breakdown… or another bear trap.
$ETH looks a lot more interesting here than the red candle makes it seem. 👀

$BTC since the bottom.
Support / prior swing low → wick or trade below it → failure to hold below → reclaim → expansion higher.
Learn how to trade this sequence and you’ll make money.

4
3
26
1,192

🚨IMPORTANT LESSON FOR EVERYONE🚨 PAY ATTENTION, class is in SESSION👨🏽💻📝✍🏻🤓🔎
This times example is $PEAQ
Pro tip: Stop treating “overbought” as an automatic sell signal.
Momentum indicators become far more useful when you combine them with market structure and key support/resistance levels.
For example: price breaks above major resistance, momentum pushes into “overbought,” and then price comes back to retest that former resistance as support.
Most traders see overbought momentum and expect a reversal.
But if that key level holds, the opposite can happen.
The successful retest confirms the breakout, buyers defend the new support, and momentum can re-accelerate dramatically as price begins its next expansion leg.
Overbought ≠ bearish. Oversold ≠ bullish.
Momentum tells you the strength of the move.
Structure tells you whether that strength has somewhere to go.
Structure + momentum > momentum alone.
I encourage you to sign up for the mentorship program and stop wasting time and money in this market - we both know you’ve lost enough that if your girl knew how bad it really was she’d divorce you, you fucking loser.
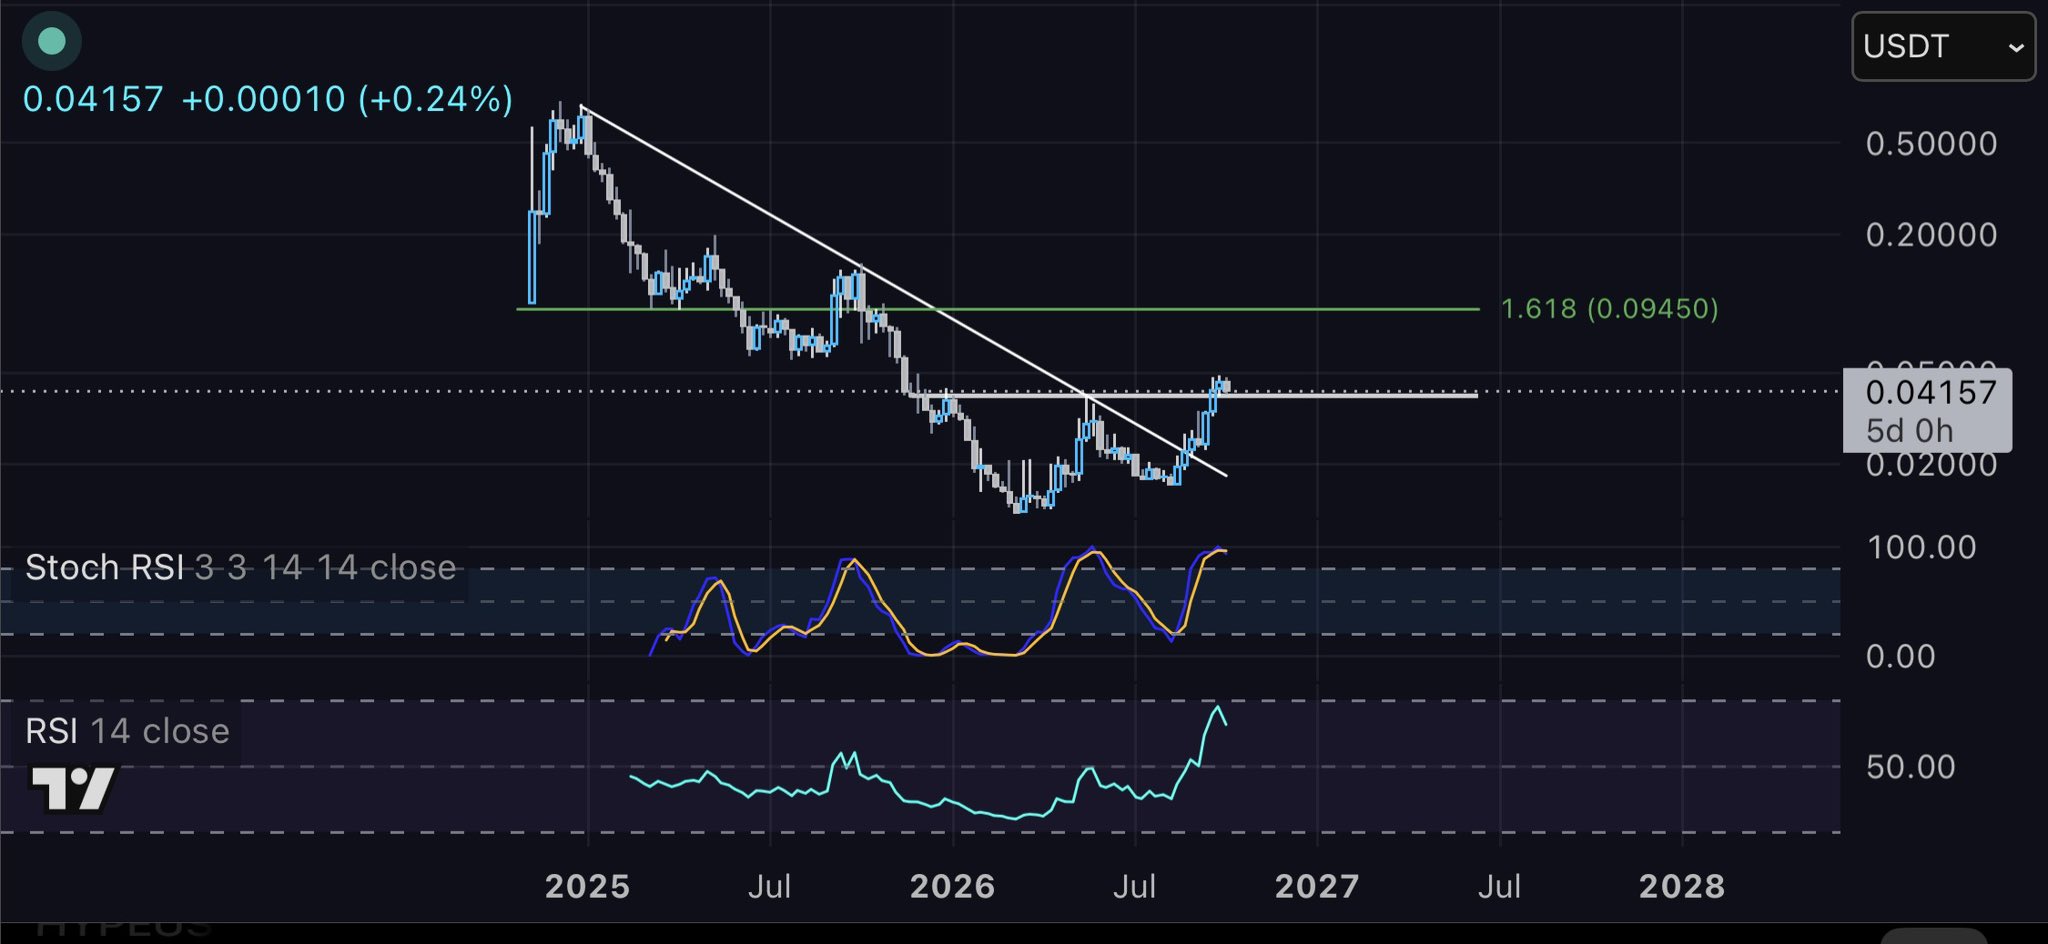
$PEAQ is one of the few crypto projects that actually feels positioned for where the world is going, not where it’s been.
Most RWA projects are just tokenizing existing financial assets. Peaq is targeting the machine economy itself …. AI agents, robots, vehicles, IoT devices, autonomous infrastructure all transacting on chain.
That’s why the upside narrative is so big.
You’re getting exposure to:
DePIN
AI
robotics
smart infrastructure
autonomous systems
And it’s already attracting serious VC backing + UAE ecosystem attention.
Still high risk obviously, but compared to a lot of recycled narratives in crypto, this one at least feels aligned with actual long-term technological trends.

5
24
1,494
Currently long $AVAX
AVAX Long - Bull Flag Continuation
Entry: $11.466
Stop Loss: $10.272
Take Profit: $17.857
Risk: 10.41%
Potential Reward: 55.74%
Risk/Reward: 5.35R
Pattern: Bull flag / bullish continuation structure following the strong impulse from ~$7 into the $11+ area.
The setup is essentially betting that AVAX breaks out of the current consolidation and begins its next leg higher toward ~$17.86. The trade is invalidated below $10.27.
You should be taking the mentorship program with me, you’d be rich by now.
Email me if you want to actually change your life - 62ndAlpha@gmail.com
Sign up to BloFin, copy trade me and have a chance to win 10k every month based on trading volume.
Link 🔗 - partner.blofin.com/d/62ndAlp…
Code 🧑💻- 62ndAlpha

$AXAV deviation complete.
Breakout target of roughly 300$.
There will be 3-6 layer 1ns that accrue the most value. On chain finance will go to trillions. Place your bets.

4
3
92
3,318
🚨🧨NEW PROJECT ALERT🧨🚨
$LNQ I had never heard of this project until today… but this one has my attention. 👀
LinqAI is sitting at the intersection of AI + DePIN + decentralized compute, and unlike a lot of “AI” tokens, LNQ actually has a defined role inside the network.
First, the chart.
LNQ spent nearly two years getting absolutely obliterated, falling from roughly $0.25+ into the $0.002 area.
But look at what has happened since.
Low → Higher Low → Higher High.
That is the first legitimate daily market-structure reversal this chart has produced in a LONG time.
Price has now exploded back toward ~$0.015, but the real test is above us.
🔴 ~$0.022–$0.025: first major HTF supply / prior support
🔴 ~$0.052–$0.060: the BIG reclamation level
Reclaim that first zone and the technical picture changes dramatically. Reclaim ~$0.05 and we’re talking about LNQ recovering a level that controlled price throughout 2025.
And because this thing is only around a $7M market cap, you don’t need hundreds of millions of dollars in new valuation to produce serious multiples. That also means extreme volatility and liquidity risk; this is micro cap territory.
Now here’s where it gets interesting…
The fundamentals are considerably better than I expected.
LinqProtocol is building a decentralized compute marketplace using real Kubernetes infrastructure, where developers deploy workloads and compute providers supply CPU/GPU resources. The protocol says it already supports 50+ deployment templates, VMs, GPU-backed deployments, on-chain escrow and AI-powered development environments.
And $LNQ isn’t just slapped onto the project for marketing.
Developers fund compute deployments with LNQ → LNQ enters an on-chain escrow → providers perform the compute → providers are paid in LNQ → protocol fees are collected.
Actual token utility tied to actual compute demand.
Tokenomics are also worth watching:
⚡ 1B max supply
⚡ ~444M circulating
🔥 113M already burned
⚡ 0% buy/sell tax
⚡ ERC-20
⚡ Supply capped > no additional minting
⚡ 429M listed as locked in Unicrypt
The bigger thesis is simple:
AI needs enormous amounts of compute.
If decentralized marketplaces can connect unused CPU/GPU capacity with developers at materially lower prices than traditional cloud providers, that’s a legitimate market and LinqProtocol currently advertises compute costs up to ~80% below major cloud providers. Those savings figures are project-reported, so I wouldn’t treat them as independently verified yet.
There IS an important catch: LinqProtocol is still in alpha and the provider fleet remains curated. The genuinely open provider marketplace and further decentralization are still being built.
So this is NOT a finished product, low risk investment.
It’s a ~$7M microcap trying to compete in one of the largest narratives in crypto.
But that’s exactly why I’m watching it.
Fundamentals: intriguing.
Token utility: real.
Valuation: tiny.
Technical structure: finally turning.
$0.022–$0.025 is the first boss fight.
$0.05+ is where this chart gets REALLY interesting.
$LNQ is officially on my radar. 🫡

2
1
17
1,160
$NEAR is breaking out, but I’d actually rather see a pullback before the next major leg.
🚨I am super long if we get this pullback🚨
On the 3D, price has exploded directly into the 0.786 Fib around $5.50 while RSI is already pushing into overbought territory. Chasing continuation here gives you worse asymmetry. A reset would make the structure much healthier.
The area I’m watching is the golden pocket around the 0.618 near $3.69, with the broader ~$3–$4 zone carrying serious confluence: prior resistance, the multi-year descending trendline, and the breakout/retest area.
A move back there wouldn’t automatically invalidate the breakout. A successful retest could confirm it. It would reset momentum, shake out late leverage, establish the old resistance as support, and give NEAR a much stronger base for expansion.
Then the roadmap gets interesting:
$5.50 → reclaim/hold the 0.786
$8–$9 → major 2024 supply
$18–$20 → previous cycle resistance/ATH region
$39.66 → 1.618 macro Fib extension
Could NEAR just rip through $5.50 and continue? Absolutely. But from a risk/reward perspective, I’d MUCH rather see breakout → golden-pocket retest → higher low → expansion than a vertical move straight into resistance with an overheated 3D RSI.
Sometimes the most bullish thing a chart can do is pull back.
$NEAR 👀

$NEAR patched up a weakness today, corrected about 10% and continues to show strength. Is this a breakout/ retest of a few important levels?

3
11
70
4,348
It will be $SUI, $SOL and $ETH for layer 1ns . Been saying this since 2023 and haven’t changed my thesis once.
🚨GOOGLE CLOUD AND SUI ARE BUILDING AI PROOF!
@Mysten_Labs and @googlecloud are building Verifiable Agent Arbiter, a record that shows an AI agent stayed inside the limits a company set.
The logs stay private in Google Cloud. The proof gets stored on @WalrusProtocol and coordinated on @SuiNetwork.
Enterprise AI audit traffic landing on Sui.

13
23
268
9,397
🚨important lesson for 99.99% of crypto twitter🚨
This happens to be lesson 185 of my year long mentorship program🤷🏽♂️
Stfu and pay attention - unless you’re a know it all, which 99.99% of you do; I’m reminded you’re all experts, daily.
People misunderstand market cap.
A $5B market cap does NOT mean $5B of capital is sitting there, and it definitely doesn’t mean you need billions of dollars to move the price.
Price is set at the margin.
And in crypto, that margin is increasingly dominated by futures/perpetual markets.
When traders pile into leveraged positions, a relatively small amount of actual collateral can control MASSIVE notional exposure.
Then the fun starts:
Futures move → arbitrage pulls spot with it → liquidation levels get hit → forced buying/selling kicks in → price accelerates.
That’s why looking at market cap alone and saying:
“There’s no way this can 5x, it would need $20B of new money!”
…is fundamentally misunderstanding how markets work.
It doesn’t.
What matters for price discovery is marginal liquidity, futures volume, open interest, leverage, funding, liquidation clusters, spot depth, and circulating float.
Market cap tells you what the network is valued at.
It does NOT tell you how much money it takes to move it.
In a leveraged crypto market, derivatives can move price FAR more aggressively than the market cap number would ever suggest.
That distinction matters massively when altseason liquidity starts flowing.
6
3
61
2,759
My screen time report is starting to look less like a phone addiction and more like a full time job at TradingView.
I’ve drawn so many trendlines I’m starting to see support and resistance in real life.
Kitchen counter? Support.
Ceiling? Resistance.
My bank account? Descending channel.
9
1
57
1,513
🚨READ VERY CAREFULLY🚨
$UNI MIGHT HAVE ONE OF THE MOST INSANE CONFLUENCE SETUPS IN CRYPTO RIGHT NOW. 🦄🔥
This isn’t some random altcoin with a pretty chart and zero fundamentals.
This is Uniswap; a protocol that has processed $4.7+ TRILLION in volume sitting beneath a macro structure developing since 2021.
UNI is attacking the multi-year descending resistance that has rejected essentially every major rally since the last cycle.
And if it breaks…the targets get ridiculous.
🎯 MACRO FIB ROADMAP
0.618 → $15.49
0.786 → $25.41
1.13 → $70.00
1.272 → $106.36
1.414 → $161.61
1.618 → $294.76
But here’s where this gets REALLY interesting:
📐 Macro pattern measured move → ~$100+
🎯 1.272 Fib → $106.36
🏦 Standard Chartered target → ~$100
Three completely different frameworks converging around the SAME price zone. 👀
And UNI’s fundamentals have changed dramatically.
🔥 THE BUYBACK/BURN ECONOMICS
For years, UNI’s biggest weakness was simple: Uniswap could dominate decentralized trading without UNI holders having much direct economic exposure.
That’s changing.
Protocol fees can now feed the TokenJar + Firepit system, connecting Uniswap activity with UNI permanently removed from circulation.
More activity → more potential fees → more UNI burned.
Governance also approved a MASSIVE 100 MILLION UNI retroactive treasury burn roughly 10% of the original 1B supply representing what could have been burned had the system existed earlier.
⛓️ UNichain → UNI
Net Unichain sequencer economics can also feed UNI burns.
UNI is increasingly capturing economics from an entire Uniswap ecosystem, not simply DEX swaps.
💰 MEV → UNI BURNS
Proposed Protocol Fee Discount Auctions (PFDA) could capture value historically lost to MEV searchers/validators and redirect auction proceeds toward UNI burns.
⚙️ UNISWAP v4
v4 Hooks transform liquidity pools into programmable financial infrastructure:
Dynamic fees. Custom execution. Specialized liquidity. Permissioned markets. New pool structures.
Proposed aggregator hooks could even source external liquidity while creating another potential fee/burn mechanism.
Uniswap is trying to become the liquidity + execution layer for onchain markets.
🏦 AND TRADFI IS SHOWING UP
Permissioned v4 infrastructure opens the door for regulated assets and institutional liquidity, with names including Securitize and Superstate involved in the ecosystem.
SMBC Nikko + Nethermind are also building a Japan-focused DeFi gateway on Uniswap v4 targeting stablecoins, RWAs and regulated digital assets.
Then comes potentially the biggest catalyst:
🌎 TOKENIZATION
Stocks. Bonds. Funds. Stablecoins. RWAs.
As traditional assets move onchain, markets become global, programmable and 24/7.
Tokenized assets are already trading through Uniswap infrastructure, with a huge portion of tokenized-equity activity occurring outside traditional U.S. market hours.
If trillions in traditional assets eventually migrate onchain, somebody needs to provide the liquidity and execution infrastructure.
Uniswap is positioning itself directly in the middle.
So zoom out:
🦄 4.7T+ historical volume
🔥 Protocol-fee-driven UNI burns
🔥 100M UNI retroactive burn
⛓️ Unichain economics → UNI burns
💰 Potential MEV capture through PFDA
⚙️ Programmable v4 Hooks
🌐 Potential aggregation of outside liquidity
🏦 Institutional / permissioned pools
🇯🇵 Japanese financial infrastructure on v4
🌎 Tokenized equities + RWAs
📈 Potential multi-year breakout
And the chart brings everything together:
Pattern target → ~$100+
1.272 Fib → $106.36
Standard Chartered → ~$100
That’s the confluence I care about.
And if UNI eventually breaks THROUGH that zone?
1.414 → $161.61
1.618 → $294.76
Those aren’t guarantees. They’re the next macro extensions if UNI enters genuine price discovery.
$UNI isn’t simply a bet on another DeFi summer.
It’s a bet that global financial markets move on chain.


8
13
86
9,969
👀🤝We were EARLY on this trade🤝👀
🕯️🔫🟢
$PUMP IS STARTING TO LOOK FUCKING RIDICULOUS. 🎰🔥
Target 1 met with CONVICTION 🎯
Everyone spent the cycle gambling on Pump.fun.
I WANT TO OWN THE CASINO.
Look at this chart.
Months trapped inside a MASSIVE descending wedge → breakout → trend reversal → higher highs → higher lows → straight back toward the old highs.
And above ~$0.009?
PRICE DISCOVERY. 🚀
My expansion ladder:
🎯 $0.01162
🎯 $0.01549
🎯 $0.02064
🎯 $0.03117 👉🏽nearly 5X from here
And the fundamentals actually MATCH the chart.
Pump.fun already has the users, volume, revenue, brand, PumpSwap and one of the strongest network effects in crypto.
This isn’t another token searching for product market fit.
THE PRODUCT ALREADY WON.
If retail mania returns, Pump.fun sits directly in front of the firehose of speculation.
🔥 Elite fundamentals
🔥 Monster narrative
🔥 Macro breakout
🔥 Price discovery approaching
I don’t think $0.01 is the destination.
I think it’s where the party fucking STARTS. 🎰🚀
$PUMP

If memes are the king of retail, then $PUMP should outperform most memes.
The casino is what brings retail back.
Working on horizontal break after diagonal was broken with conviction.

5
5
41
2,632
🚨 $ONDO MIGHT BE ONE OF THE MOST VIOLENTLY UNDERPRICED RWA PLAYS IN CRYPTO. (OFF the back of $ONDO & $NEAR Partnership).
And this chart is starting to look absolutely ridiculous.
After spending YEARS trapped beneath a massive descending trendline, ONDO compressed into a beautiful bullish flag/wedge…
Then it broke out.
Now?
Price is coming back to RETEST THE ENTIRE MACRO DIAGONAL FROM ABOVE. 👀
If this breakout confirms, the upside ladder gets stupid FAST:
🎯 $0.54 — 0.382
🎯 $0.69 — 0.50
🎯 $0.89 — 0.618
🎯 $1.28 — 0.786
🔥 $2.67 — 1.13
🔥 $3.62 — 1.272
🚀 $4.91 — 1.414
🪐 $7.60 — 1.618
And here’s where it gets even crazier:
The measured move from the flag itself starts pushing price directly into that upper expansion zone.
So you have a macro breakout.
A diagonal retest.
A bullish flag measured move.
And Fibonacci extensions stacking higher and higher.
But forget the chart for a second…
LOOK AT WHAT ONDO IS ACTUALLY BUILDING.
Ondo isn’t trying to become another DeFi protocol.
It’s positioning itself as THE BRIDGE BETWEEN WALL STREET AND CRYPTO.
BlackRock.
State Street.
Franklin Templeton.
Fidelity.
Chainlink.
Broadridge.
Clearstream / Deutsche Börse.
SBI Group.
Mirae Asset.
This isn’t some meme narrative hoping institutions eventually arrive.
THE INSTITUTIONS ARE ALREADY HERE.
Ondo is attacking one of the biggest opportunities in the entire industry:
TOKENIZING GLOBAL FINANCIAL MARKETS.
Treasuries → onchain.
Stocks → onchain.
ETFs → onchain.
Institutional portfolios → onchain.
And if tokenization ultimately becomes a multi-trillion-dollar crypto vertical, the question isn’t whether the sector gets huge.
The question is:
WHO BECOMES THE MARKET LEADER?
And ONDO is making one hell of a case.
The chart is breaking out.
The fundamentals are accelerating.
The institutions are integrating.
The RWA narrative is exploding.
And price is still sitting around $0.50.
If this structure fully resolves…
$1 isn’t the target.
It might just be where the party STARTS. 🔥
$ONDO → WALL STREET, ONCHAIN.

$ONDO just feels too cheap. The team absolutely crushes and they are by FAR the leader in the RWA space. One of like 50 projects that are actually making moves in the entire space.
Look at this chart. Either this is a massive opportunity or I’m retarded.

6
20
118
5,148
🚨U R MAKING THIS MISTAKE IN MARKETS🚨 BITCOIN & CRYPTO R TAKING OVER THE ... youtube.com/shorts/bpS2-rXuC… via @YouTube
10
1,307
$RENDER is like $NEAR or $ZCASH when it comes to price potential…
💵💰💸💵🤑🤑
Our dear OG might be one of the most violently mispriced AI plays in #crypto right now.
And this chart is starting to look absolutely ridiculous.
RENDER has spent YEARS compressing underneath a massive descending structure while the fundamental thesis has only gotten stronger.
Now it’s attempting to break out.
The roadmap if this structure flips:
🎯 $2.96 — 0.618
🎯 $5.72 — 0.786
🎯 $22.05 — 1.13
🎯 $38.49 — 1.272
🎯 $67.19 — 1.414
🎯 $149.58 — 1.618
No, I’m not saying RENDER magically teleports to $150 because a Fibonacci level exists.
I’m saying look at what happens if a multi year compression breaks while the market simultaneously begins repricing RENDER for what it is becoming.
This isn’t another token with “AI” slapped onto the roadmap… 👋🏽
🚨Render has been building decentralized GPU infrastructure since 2017🚨
GPU rendering.
AI inference.
AI training & fine-tuning.
Generative media.
3D graphics.
Spatial computing.
DePIN.
The world is becoming exponentially more compute intensive, and GPUs are the picks and shovels of that expansion.
Render is building a marketplace for them.
That is what separates $RENDER from 99% of the AI narrative in crypto.
And technically?
Multi year compression.
Descending structure being challenged.
Weekly MACD curling bullish.
Major Fib reclaim directly overhead.
Enormous extension levels if price eventually enters discovery.
The market is still pricing RENDER like an altcoin.
I’m looking at it like decentralized GPU infrastructure for an AI native world.
If this breakout confirms, I think people are going to understand very quickly why I’m so bullish.
$RENDER 🚀

10
26
173
7,190
$DOGE looks like it’s loading for something MUCH bigger. 🐕🚀
Forget the meme for a second and just look at the chart.
DOGE has spent years building a massive higher timeframe structure, and now price is beginning to work its way back through the levels that matter.
The Fibonaccis are where this gets interesting.
Once DOGE starts reclaiming the major Fib levels from the previous cycle, each break opens the door to the next extension, with the 1.272, 1.414, 1.618 and higher extensions becoming increasingly relevant if DOGE enters true price discovery.
And DOGE has a history of dramatically overshooting when it enters the euphoric phase of a crypto cycle.
But the Fibs arent the only thing pointing higher.
📦 The box based measured move on this chart projects a completely separate upside target.
That matters because when multiple independent forms of TA, market structure, Fib extensions and measured moves, begin pointing toward the same general region, that’s the kind of confluence I pay attention to.
The short term battle is still around $0.10–$0.106. DOGE reclaiming that area would clear the recent swing high and strengthen the larger breakout structure. Current daily momentum and moving averages are already leaning bullish.
After that?
I’m watching the Fibs.
I’m watching the box target.
And I’m watching for DOGE to do what DOGE has done every major cycle:
Absolutely nothing… until suddenly it does everything. 🐕🌕
$DOGE

12
16
139
6,063
$RAY might be one of the cleanest Solana DeFi setups hiding in plain sight 😮💨
The chart is starting to tell a VERY interesting story.
After spending most of 2026 grinding through a massive descending structure, now it’s attempting to break out of that multi year compression.
The roadmap from here is pretty straightforward:
→ Breakout from the descending structure
→ ~$3.50–$4 = first major reclaim
→ ~$6–$7 = major HTF supply
→ ~$15 = previous cycle resistance
→ Price discovery above that opens an entirely different conversation
And that long term rising trendline? If RAY eventually reconnects with it, we’re talking about levels dramatically higher than where price trades today.
But the fundamentals are what make this chart REALLY interesting.🔎
Raydium isn’t some dead 2021 DEX waiting for liquidity to return. ☠️
It’s one of the core liquidity engines of $SOL.
Raydium currently sits around $1.35B TVL, has processed roughly $9.9B in DEX volume over the last 30 days, and generated around $46M in 30-day fees. (DefiLlama)
LaunchLab has expanded Raydium directly into the token launch economy, while Raydium now offers CPMM + concentrated liquidity, token launches and perpetuals from the same ecosystem. (GitHub)
And here’s the part I REALLY like:
Protocol activity is a feedback loop.🔁
Across Raydium’s AMM pools, 12% of trading fees are allocated toward RAY buybacks, while LaunchLab also directs part of protocol fees toward buying back and burning RAY. (DefiLlama)
Raydium is also becoming a serious venue for tokenized assets on Solana, with recent reports putting cumulative tokenized-stock volume through Raydium above $6 BILLION. (CoinStats)
So the thesis isn’t complicated:
Solana grows → activity grows
Activity grows → Raydium volume grows
Volume grows → fees grow
Fees grow → RAY buybacks grow
Now put THAT fundamental flywheel underneath a multi year technical breakout.
$RAY at ~$2 isn’t interesting because it used to trade at $15+.
It’s interesting because the protocol underneath it may be significantly stronger than it was the last time it traded there.
Reclaim $4 → attack $6–$7 → $15 becomes the monster HTF level.
Above that?
🚀 PRICE DISCOVERY.
This is exactly the type of chart I want to be watching before the crowd starts drawing the targets 🎯

3
1
26
2,208