

Market Structure • Liquidity • Cycles #Crypto Analyst | Since 2019
Digital assets
- Tweets 6,833
- Following 46
- Followers 5,476
- Likes 8,168


$BTC Prolonged bearish cycle with potential bottom range of around $30k.
You can clearly see that my BTC thesis is based strictly on historical data and structural analysis.
The quoted post explains in greater detail how I compared the current Bitcoin structure with all historical bear market structures.
I’m not simply cherry-picking the parts of past cycles I like and forcing them into the 2026 cycle. I’m analyzing each structure from beginning to end, comparing its phases, timing, and price behavior with Bitcoin’s previous bear markets.
Meanwhile, it seems that 90% of the traders has already started drawing bottom formations on BTC without analyzing the entire structure. Many are simply copying the fragments of past cycles that fit their expectations and applying them to 2026.
That’s not structural analysis. That’s confirmation bias.
Emotions can make people focus on the outcome they want while ignoring historical evidence that challenges their thesis.
My analysis suggests that Bitcoin’s bottom is still be ahead, with a potential target in the $30K range, and that the current cycle could follow a prolonged bearish structure similar to 2013–2015. Which is lasted more than one year.


$BTC
Following up on my previous post about the three relief rallies within major Bitcoin bear-market structures, I want to highlight another interesting detail.
When we measure these rallies, there is often a clear progression in their magnitude: the first is smaller, the second becomes stronger, and the third tends to be the strongest relief rally before the major bearish continuation.
Looking across the major structures:
2011: +45% → +70% → +79%
2013–15: +55% → +60% → +84%
2017–18: +30% → +40% → +68%
2021–22: +25.0% → +30.1% → +40.0%
Current: +21.3% → +37.5% → +42.2%
The percentages are obviously not identical from cycle to cycle, but the character of the progression is what matters:
smaller → stronger → strongest → bearish continuation.
This is also why I don’t automatically interpret a strong recovery inside a bear structure as the beginning of a new bull market. Historically, the largest relief rally can appear very close to the transition into the next major bearish phase.


12
1
41
15,994
$ETH
Some people may not fully understand how I’m comparing the current structure with the 2021–2022 structure.
So I wasn’t lazy — I made an additional chart breaking down each section and showing exactly how I’m comparing them.
The main difference between the two structures is that the current structure is roughly 40% larger in size, as I’ve explained before.
And when the overall structure is ~40% larger, the individual upward and downward impulses are proportionally larger as well.
That also means these impulses naturally require more time to develop, which makes the overall structure take longer to complete.
So when comparing the two structures, you can’t simply compare the number of moves or their duration. The size and proportions of each move matter as well.

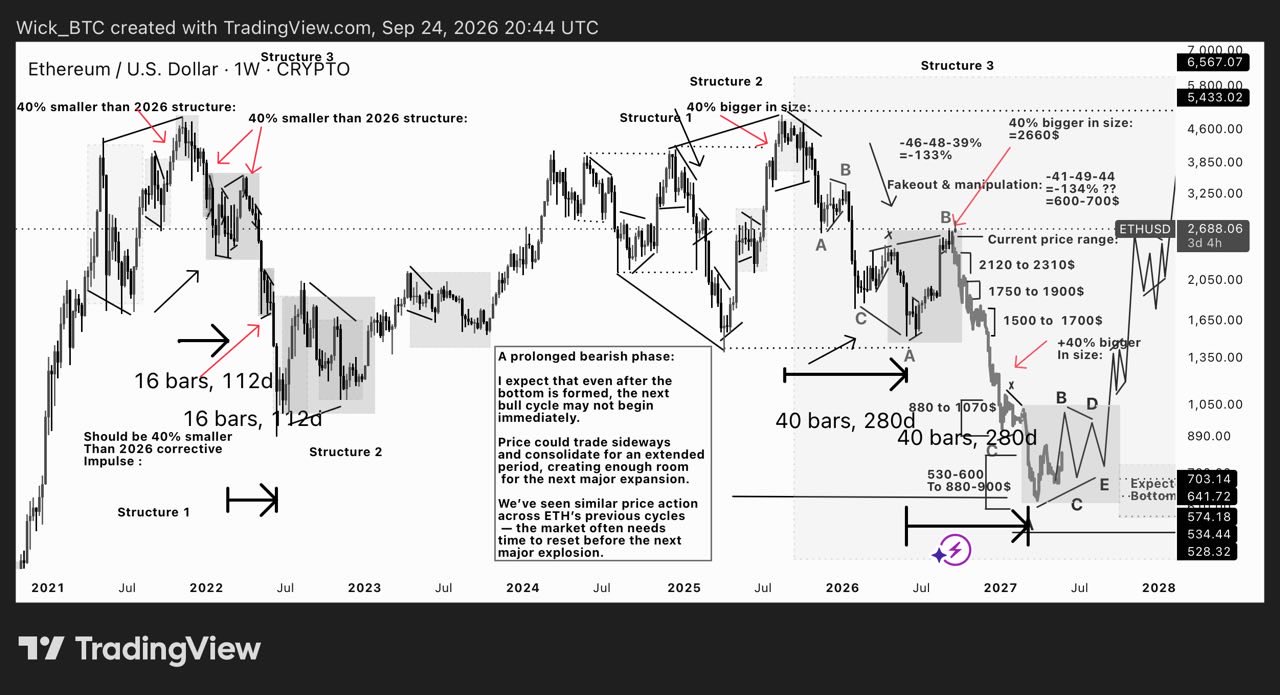
I think the weekly $ETH chart will help you understand how I’m counting the current structure and why I believe it is closely repeating the structure ETH developed in 2022.
The main difference is scale: the current structure is roughly 40% larger than the 2022 structure. Because of that, I’m assuming the corresponding upside and downside moves should also be proportionally larger. ( look
At quoted post )
In the 2022 structure, ETH experienced a strong relief rally of approximately +55% from the local lows.
So, if the current structure is ~40% larger, I scaled that move accordingly:
55% × 1.40 ≈ 77%
That projection pointed toward the $2,660 area.
And this is exactly what happened — ETH swept the $2,660 range almost perfectly, followed by an immediate rejection.
For me, this is another important piece of evidence that the current ETH structure is following the same underlying pattern as 2022, but on a larger scale.

1
1
5
787
$BTC : And you think the move from $69K to $15K in the previous cycle was a “gift” from the market to traders and investors?
Nope. Let me explain how it actually works.
These three major relief rallies have appeared in previous Bitcoin bear-market cycles before the market eventually reached its true cycle bottom.
Look at the previous cycle: before Bitcoin reached $15K, we saw three major relief rallies along the way, marked by the red arrows on the chart.
Now look at the current cycle.
We’ve seen the same three major relief rallies develop again — and the latest one has just completed.
So why do these relief rallies appear?
Because the majority of market participants don’t wait for the bottom. They buy into these relief rallies, believing the bull run has started again.
They see Bitcoin recovering strongly and think:
“The bear market is over. The next bull run has started.”
So they buy.
Then the market reverses and moves lower again.
The same process can repeat multiple times — until eventually, after enough failed relief rallies, panic takes over.
That’s why by the time Bitcoin reaches the true cycle bottom, many participants who could have bought those cheap prices are already out of the market — liquidated, stopped out, or having sold their spot positions in panic.
This is what makes the previous cycles so interesting: three major relief rallies appeared before the final crash into the true cycle bottom.
And now, the current cycle has produced the same three-relief-rally structure, with the latest one just completed.
The market doesn’t need to make the bottom obvious.

This post is more of an answer to the people in my comments asking:
“Why would the market give you ETH at $528–700 and BTC at $32K? Why would the market give people those cheap prices to buy?”
Brother, let me put it simply:
Once those levels are reached, unfortunately the majority may be left with nothing to buy with. This is how every bear cycle works.
Why? Because they already bought after seeing the latest Bitcoin relief rally. When the market eventually moves much lower, fear and panic can force even spot holders to sell — leaving them without capital when the real dip arrives.
And don’t forget: every bear market eventually reaches price levels that the majority never believed were possible.
$BTC $ETH
2
1
15
1,615
This post is more of an answer to the people in my comments asking:
“Why would the market give you ETH at $528–700 and BTC at $32K? Why would the market give people those cheap prices to buy?”
Brother, let me put it simply:
Once those levels are reached, unfortunately the majority may be left with nothing to buy with. This is how every bear cycle works.
Why? Because they already bought after seeing the latest Bitcoin relief rally. When the market eventually moves much lower, fear and panic can force even spot holders to sell — leaving them without capital when the real dip arrives.
And don’t forget: every bear market eventually reaches price levels that the majority never believed were possible.
$BTC $ETH
This is exactly what the market wants you to do: it wants you to buy at these levels before the real bottom arrives.
Then, when the market continues lower, you either get liquidated or panic and sell even your spot positions — leaving you with nothing left to buy the real dip.
And some influencers putting their audiences into longs right now may potentially be contributing to this. They’re effectively turning their followers into potential liquidity for the next major crash.
We saw this level of fear and panic in previous cycles, but we haven’t seen it during the current cycle yet.
So be prepared: that phase will still come over the next few months.
$BTC

1
11
2,647
This is exactly what the market wants you to do: it wants you to buy at these levels before the real bottom arrives.
Then, when the market continues lower, you either get liquidated or panic and sell even your spot positions — leaving you with nothing left to buy the real dip.
And some influencers putting their audiences into longs right now may potentially be contributing to this. They’re effectively turning their followers into potential liquidity for the next major crash.
We saw this level of fear and panic in previous cycles, but we haven’t seen it during the current cycle yet.
So be prepared: that phase will still come over the next few months.
$BTC
$BTC : An important post that can help you protect your capital — and potentially grow it instead of losing it.
I wouldn’t suggest taking unnecessary risks here. If you don’t want to swing short from these levels with us, then simply stay in USDT and wait.
Don’t try to catch every move, and don’t scalp just because the market is moving. You can easily get stuck in a position and potentially be unable to exit until the true cycle bottom arrives.
And especially, I wouldn’t suggest buying from here — not even for a scalp, and not even on spot. Don’t play with market.
You might be thinking: “Why not buy? Bitcoin will eventually make a new ATH anyway.”
But that’s not how the market works.
Every bear market eventually takes price to levels that the majority never believed were possible. That’s what creates the extreme fear and panic that eventually forces people out of their positions.
We haven’t seen that level of fear and panic during this cycle yet.
Eventually, people start thinking “this is the end of crypto” and lose hope that Bitcoin will ever recover. And when that happens, even spot holders start selling their positions because of fear and losing hope, despite having no leverage.
That is the kind of capitulation we saw in previous cycles — but we haven’t experienced it in this cycle yet.
In my view, this is something we will experience over the coming months as the market eventually reaches the true cycle bottom.
I don’t want you to get liquidated before the true bottom arrives, or burn through your capital trying to catch every move, only to have nothing left when the real dip finally comes.
Preserve your capital.
The goal is to still have liquidity when the true cycle bottom arrives — and then be ready to participate in the next bull run.

1
4
2,006
$BTC : An important post that can help you protect your capital — and potentially grow it instead of losing it.
I wouldn’t suggest taking unnecessary risks here. If you don’t want to swing short from these levels with us, then simply stay in USDT and wait.
Don’t try to catch every move, and don’t scalp just because the market is moving. You can easily get stuck in a position and potentially be unable to exit until the true cycle bottom arrives.
And especially, I wouldn’t suggest buying from here — not even for a scalp, and not even on spot. Don’t play with market.
You might be thinking: “Why not buy? Bitcoin will eventually make a new ATH anyway.”
But that’s not how the market works.
Every bear market eventually takes price to levels that the majority never believed were possible. That’s what creates the extreme fear and panic that eventually forces people out of their positions.
We haven’t seen that level of fear and panic during this cycle yet.
Eventually, people start thinking “this is the end of crypto” and lose hope that Bitcoin will ever recover. And when that happens, even spot holders start selling their positions because of fear and losing hope, despite having no leverage.
That is the kind of capitulation we saw in previous cycles — but we haven’t experienced it in this cycle yet.
In my view, this is something we will experience over the coming months as the market eventually reaches the true cycle bottom.
I don’t want you to get liquidated before the true bottom arrives, or burn through your capital trying to catch every move, only to have nothing left when the real dip finally comes.
Preserve your capital.
The goal is to still have liquidity when the true cycle bottom arrives — and then be ready to participate in the next bull run.
$BTC : worth to read full text , I promise it will be very interesting for you.
This is how we can estimate how much Bitcoin could correct from its $126K ATH to the true cycle bottom.
First, we analyzed the distance from one cycle bottom to the next. Now, we can take the same approach one step further: without changing anything on the chart, we simply compare the percentage correction from each cycle top to its true bottom.
As you know, Bitcoin’s long-term trend angles continue to compress with each cycle. As a result, both bull-market expansions and bear-market corrections have become progressively shallower over time.
Let’s look at the historical progression:
2011: −93.7%
2014–2015: −86.28%
2018: −84.40%
2022: −77.90%
2026–2027: potentially around −73.90%
If this pattern of declining correction depth continues, a ~73.9% correction from the $126K ATH would place Bitcoin around $32K, which is the true cycle-bottom zone I’m watching.
The interesting part is that both the bottom-to-bottom distance and the top-to-bottom correction are showing the same progressive compression.
And this is exactly why, in my view, $58K doesn’t fit as the true cycle bottom.
Yes, Bitcoin’s corrections are getting shallower — but the historical progression does not suggest an aggressive jump from a −77.9% correction to only ~−54% (the ~$58K zone).
That would represent roughly a 24 percentage-point reduction in correction depth — an unusually large step compared with the historical progression. In the previous cycles, the reductions have generally happened much more gradually, roughly in the 3–6 percentage-point range.
The compression has been happening gradually, cycle after cycle. In my view, that progression points much closer to a ~−73.9% correction, rather than a dramatic reduction all the way to ~−54%.
This is why I continue to view ~$32K as a potential true cycle-bottom zone, rather than ~$58K.

2
1
10
1,827
This is how it works:
All the things you’ve seen happen in previous cycles haven’t happened in the current cycle yet. That doesn’t mean the historical structure has disappeared — it’s about timing.
You simply need to give the market time.
Over the coming months, many of the same things we saw in previous cycles can still unfold again in the current cycle — but this time on a different timeline.
The structure is developing differently in terms of timing, not necessarily in terms of the final pattern.
The true bottom is still ahead.
$BTC
$BTC Prolonged Bearish Phase
Why did I make this post?
Because I was reading the comments, and some people were saying it’s weird that we’ve seen so much FUD — similar to what we saw in previous cycles — but this time it hasn’t had the same negative effect on Bitcoin.
People are also asking how Bitcoin can keep rising despite the challenging macroeconomic environment and all the uncertainty we’re seeing globally.
My answer is simple: give the market time.
Let this cycle develop, and you’ll see that it can still rhyme with the same historical structures we’ve seen before.
There are several things I want to point out.
So, what is actually different this time?
USDT.D: Historically, USDT.D has broken its previous ATH during major Bitcoin capitulation phases. This time, it hasn’t even reached the previous double-top area yet.
S&P 500 vs. Bitcoin: In previous cycles — except 2013–2015 — the S&P 500 generally moved in rhythm with Bitcoin, with both assets reaching their major bottoms within roughly a month of each other. The 2013–2015 cycle was the major exception.
Realized Price: Historically, Bitcoin has bottomed below Realized Price. This time, Bitcoin hasn’t even reached Realized Price yet.
12M candle: Historically, Bitcoin’s major cycle bottoms were accompanied by a full-bodied red 12M candle. The current 12M candle is still only showing a wick.
Timing: Historically, Bitcoin hasn’t formed a major cycle bottom before roughly one year, with the 2011 cycle being the main exception. Why was 2011 different? Because Bitcoin was still at the very beginning of its history. The trend angles had not yet compressed to the critical levels we see today.
That’s why I believe the current Bitcoin structure requires more time in a bearish phase to create the conditions and room necessary for the next major expansion. Otherwise, there may not be enough structural room for Bitcoin to reach a new ATH.
And then there’s another important point:
Why did Bitcoin suddenly start rallying just before the one-year mark?
That behavior is something we haven’t seen in the same way in previous cycles.
Bitcoin’s corrections and expansions have historically become shallower cycle by cycle, but the reduction has generally been around 3–6%.
So why would the compression suddenly jump from 77.9% to roughly 53–54% this time?
Instead of assuming that history has suddenly stopped working, give the market time.
Over the coming months, this prolonged bearish cycle can still show whether Bitcoin completes these historical patterns once again.
That’s exactly what I’ve been explaining since the beginning:
This cycle is different in timing because it is developing as a prolonged bearish cycle — lasting more than one year.
10
1,062
$BTC Prolonged Bearish Phase
Why did I make this post?
Because I was reading the comments, and some people were saying it’s weird that we’ve seen so much FUD — similar to what we saw in previous cycles — but this time it hasn’t had the same negative effect on Bitcoin.
People are also asking how Bitcoin can keep rising despite the challenging macroeconomic environment and all the uncertainty we’re seeing globally.
My answer is simple: give the market time.
Let this cycle develop, and you’ll see that it can still rhyme with the same historical structures we’ve seen before.
There are several things I want to point out.
So, what is actually different this time?
USDT.D: Historically, USDT.D has broken its previous ATH during major Bitcoin capitulation phases. This time, it hasn’t even reached the previous double-top area yet.
S&P 500 vs. Bitcoin: In previous cycles — except 2013–2015 — the S&P 500 generally moved in rhythm with Bitcoin, with both assets reaching their major bottoms within roughly a month of each other. The 2013–2015 cycle was the major exception.
Realized Price: Historically, Bitcoin has bottomed below Realized Price. This time, Bitcoin hasn’t even reached Realized Price yet.
12M candle: Historically, Bitcoin’s major cycle bottoms were accompanied by a full-bodied red 12M candle. The current 12M candle is still only showing a wick.
Timing: Historically, Bitcoin hasn’t formed a major cycle bottom before roughly one year, with the 2011 cycle being the main exception. Why was 2011 different? Because Bitcoin was still at the very beginning of its history. The trend angles had not yet compressed to the critical levels we see today.
That’s why I believe the current Bitcoin structure requires more time in a bearish phase to create the conditions and room necessary for the next major expansion. Otherwise, there may not be enough structural room for Bitcoin to reach a new ATH.
And then there’s another important point:
Why did Bitcoin suddenly start rallying just before the one-year mark?
That behavior is something we haven’t seen in the same way in previous cycles.
Bitcoin’s corrections and expansions have historically become shallower cycle by cycle, but the reduction has generally been around 3–6%.
So why would the compression suddenly jump from 77.9% to roughly 53–54% this time?
Instead of assuming that history has suddenly stopped working, give the market time.
Over the coming months, this prolonged bearish cycle can still show whether Bitcoin completes these historical patterns once again.
That’s exactly what I’ve been explaining since the beginning:
This cycle is different in timing because it is developing as a prolonged bearish cycle — lasting more than one year.
$BTC : worth to read full text , I promise it will be very interesting for you.
This is how we can estimate how much Bitcoin could correct from its $126K ATH to the true cycle bottom.
First, we analyzed the distance from one cycle bottom to the next. Now, we can take the same approach one step further: without changing anything on the chart, we simply compare the percentage correction from each cycle top to its true bottom.
As you know, Bitcoin’s long-term trend angles continue to compress with each cycle. As a result, both bull-market expansions and bear-market corrections have become progressively shallower over time.
Let’s look at the historical progression:
2011: −93.7%
2014–2015: −86.28%
2018: −84.40%
2022: −77.90%
2026–2027: potentially around −73.90%
If this pattern of declining correction depth continues, a ~73.9% correction from the $126K ATH would place Bitcoin around $32K, which is the true cycle-bottom zone I’m watching.
The interesting part is that both the bottom-to-bottom distance and the top-to-bottom correction are showing the same progressive compression.
And this is exactly why, in my view, $58K doesn’t fit as the true cycle bottom.
Yes, Bitcoin’s corrections are getting shallower — but the historical progression does not suggest an aggressive jump from a −77.9% correction to only ~−54% (the ~$58K zone).
That would represent roughly a 24 percentage-point reduction in correction depth — an unusually large step compared with the historical progression. In the previous cycles, the reductions have generally happened much more gradually, roughly in the 3–6 percentage-point range.
The compression has been happening gradually, cycle after cycle. In my view, that progression points much closer to a ~−73.9% correction, rather than a dramatic reduction all the way to ~−54%.
This is why I continue to view ~$32K as a potential true cycle-bottom zone, rather than ~$58K.
2
6
1,717
All the weird things you’re seeing in the market right now have one key explanation: a prolonged bearish cycle.
Bitcoin’s current structure is developing into a prolonged bearish cycle — and the last time we saw so many of these unusual things happening at the same time was 10–12 years ago, during the 2013–2015 cycle.
$BTC

$BTC
If my interpretation is correct, Bitcoin may follow a larger 12-year structure, consisting of three separate 4-year cycles.
Within this framework, each 12-year structure could potentially develop as follows:
Phase 1: The first 4-year cycle, followed by a relatively standard ~1-year bear market.
Phase 2: The second 4-year cycle, where a longer-than-one-year bear market occurs — essentially a deeper structural reset.
Phase 3: The third 4-year cycle, followed by another relatively standard ~1-year bear market.
Since Bitcoin’s history began around 2010, we are now roughly 16 years into its development. That means one complete 12-year structure has already played out, including one prolonged bearish phase — the 2013–2015 bear market.
Then, starting around 2022, Bitcoin may have entered a new large-scale 12-year structure.
The first 4-year cycle of this new structure has already completed, including a relatively standard ~1-year bear market in 2022.
If this framework is correct, we are now entering Phase 2 — the part of the larger structure where another prolonged bear market could occur.
And if the pattern continues, the third 4-year cycle could eventually be followed by another more typical ~1-year bear market.

1
1
7
1,087
1. $XAU/BTC: This could be the first cycle in which XAU/BTC finally makes a new local high — breaking above its previous high for the first time.
2. Bitcoin: This would be the second cycle in which Bitcoin develops a prolonged bearish cycle. The first was the 2013–2015 cycle.
3. Bitcoin vs. S&P 500: This would also be the second cycle in which Bitcoin becomes structurally disconnected from the S&P 500. The last time we saw this was during 2013–2015, when the S&P 500 continued rising while Bitcoin remained in a prolonged bearish cycle.
4.Ethereum: This would be the second cycle in which ETH experiences such an aggressive reset — potentially around -90% from its ~$4,900 peak. The first comparable reset occurred during the 2018–2019 cycle.
And all the reasons behind these observations have already been explained in my previous posts. I laid out this thesis a long time ago, based on historical facts and recurring market structures, not speculation.
$BTC $ETH
$BTC #SP500
Here’s another interesting piece of evidence supporting my expectation that the current Bitcoin bearish cycle will rhyme with the prolonged 2013–2015 cycle.
One of the key similarities is the significant divergence between Bitcoin and the S&P 500.
During the 2013–2015 bear market, Bitcoin became increasingly disconnected from the S&P 500’s rhythm. While the S&P 500 continued trending higher, Bitcoin entered a prolonged structural decline and followed its own cycle.
What’s interesting is that in the other major Bitcoin cycles, BTC generally rhymed much more closely with the S&P 500. Their broader market rhythms were more aligned, and major corrections in Bitcoin and the S&P 500 tended to occur at approximately the same time.
But this time, just like in 2013–2015, we are seeing a different relationship developing.
Bitcoin is increasingly moving away from the S&P 500’s rhythm, while the S&P 500 continues to follow its own bullish structure.
This is another reason why I believe the current cycle is not simply a copy of 2022. Instead, the market appears to be developing characteristics much closer to the 2013–2015 prolonged bearish cycle.
And this is exactly the scenario I’ve been discussing for the past three months.

2
4
1,331


This is one of my favorite posts. I like staying prepared for every possible scenario.
$BTC
$BTC: about the true bottom formation in the coming months:
As you can see on my chart, the real cycle-bottom formation has historically developed through an ABCDE structure, often taking a shape that resembles a triangle. You can also look at the historical charts in the quoted post to see these structures more clearly.
Across the four major bear cycles, we’ve seen this type of ABCDE bottom formation. Interestingly, in only one of those cycles — 2011 — did the final Wave (E) fail to sweep slightly lower and establish a new cycle low. In the following three cycles, Wave (E) did sweep the previous low, creating either a new cycle low or something resembling a double-bottom structure.
Of course, it’s still too early to know exactly how the current cycle will develop. We’ll only find out once Bitcoin actually enters the true bottom-formation phase. But I want to outline the possible paths I’m watching.
Scenario 1
Bitcoin first declines toward the $36K area and begins forming the bottoming structure. Then, the final Wave (E) could sweep down toward $32K, followed by an immediate reversal and the beginning of the next bull phase.
Scenario 2
Bitcoin first declines directly toward the $32K area and begins forming the bottoming structure there. Then, the final Wave (E) could sweep even lower into the $30K–$27K range, before the market immediately reverses into a new bull phase.
This is exactly why I’m not giving one fixed bottom price.
It’s impossible to know in advance whether the final Wave (E) sweep will happen — or how deep it could go. That’s why I’ve marked a range of potential bottom levels: roughly $36K → $32K → $27K.
Once Bitcoin reaches that stage, we can watch the structure develop in real time and see how this cycle’s ABCDE bottom formation actually plays out.

2
8
1,219
So over the next 550- 600 days, we can simply watch how this current cycle develops.
Bitcoin could spend more than one year in a bearish phase, similar to 2013–2015, which would support my thesis about a prolonged bearish cycle.
At the same time, within that 500–600-day window, Bitcoin could still reach a new ATH.
Both things can happen within the next 500–600 days without requiring some people’s assumption that the cycle is “accelerating.”
$BTC

$BTC : — read the full text to fully understand the context and the point I’m making.
Honestly, I’ve seen people saying that Bitcoin cycles are “accelerating,” and because of that, they assume Bitcoin should reach/or reached its bottom within less than one year of the bearish cycle.
it don’t work that way guys , If you want to make a really useful comparison, you need to measure from the cycle bottom to the next ATH, as I’ve done on my chart.
Let me explain.
I don’t see a clear mathematical basis for that assumption.
Bitcoin is still following a broader ~4-year cycle structure, but there is no fixed duration or mathematical rule saying that each cycle must reach its next ATH faster than the previous one.
And even more importantly, there is nothing in the historical data saying that the cycle bottom itself must occur within one year or less.
So far, we have four completed cycles measured from cycle bottom → next ATH:
2011 → 2013: 458 days
2015 → 2017: 721 days
2018 → 2020: 717 days
2022 → 2024: 473 days
What does this tell us?
There is no consistent mathematical sequence showing that each cycle is becoming shorter.
We’ve had cycles around 458–473 days, and we’ve also had cycles around 700+ days.
And there’s another important point: the length of the bearish phase itself does not determine how quickly Bitcoin reaches the next ATH.
For example, during the 2013–2015 prolonged bearish phase, Bitcoin took around 411 days to reach the cycle bottom, yet it still took roughly 700 days from that bottom to reach a new ATH.
The 2018 cycle is another example. The bearish phase lasted roughly one year, but Bitcoin still needed around 700 days from the cycle bottom to reach the next ATH.
So a one-year bear market does not automatically mean the bottom must already be in. And it certainly doesn’t mean the next ATH has to come quickly afterward.
Likewise, a prolonged bearish phase does not invalidate the broader ~4-year cycle structure.
If you want to argue that Bitcoin cycles are accelerating, you need more than a shorter ATH-to-ATH interval. You need to show a consistent acceleration in the actual cycle structure — and the bottom-to-ATH data doesn’t show that.

3
16
1,521
Also Don’t listen to anyone claiming that the Bitcoin cycle is “accelerating.”
We’re still operating within the broader 4-year cycle.
It doesn’t matter how quickly Bitcoin reaches a new ATH after the true cycle bottom — the market can still spend a year or more in a bear phase before that happens. These are two separate things.
In fact, meaningful bear markets are part of the foundation of Bitcoin’s long-term bullish structure. Without a proper bearish reset, the market can’t sustain the conditions needed to build another major cycle and eventually reach new ATHs.
The speed of the next recovery doesn’t invalidate the bear market that comes before it.
$BTC
$BTC : — read the full text to fully understand the context and the point I’m making.
Honestly, I’ve seen people saying that Bitcoin cycles are “accelerating,” and because of that, they assume Bitcoin should reach/or reached its bottom within less than one year of the bearish cycle.
it don’t work that way guys , If you want to make a really useful comparison, you need to measure from the cycle bottom to the next ATH, as I’ve done on my chart.
Let me explain.
I don’t see a clear mathematical basis for that assumption.
Bitcoin is still following a broader ~4-year cycle structure, but there is no fixed duration or mathematical rule saying that each cycle must reach its next ATH faster than the previous one.
And even more importantly, there is nothing in the historical data saying that the cycle bottom itself must occur within one year or less.
So far, we have four completed cycles measured from cycle bottom → next ATH:
2011 → 2013: 458 days
2015 → 2017: 721 days
2018 → 2020: 717 days
2022 → 2024: 473 days
What does this tell us?
There is no consistent mathematical sequence showing that each cycle is becoming shorter.
We’ve had cycles around 458–473 days, and we’ve also had cycles around 700+ days.
And there’s another important point: the length of the bearish phase itself does not determine how quickly Bitcoin reaches the next ATH.
For example, during the 2013–2015 prolonged bearish phase, Bitcoin took around 411 days to reach the cycle bottom, yet it still took roughly 700 days from that bottom to reach a new ATH.
The 2018 cycle is another example. The bearish phase lasted roughly one year, but Bitcoin still needed around 700 days from the cycle bottom to reach the next ATH.
So a one-year bear market does not automatically mean the bottom must already be in. And it certainly doesn’t mean the next ATH has to come quickly afterward.
Likewise, a prolonged bearish phase does not invalidate the broader ~4-year cycle structure.
If you want to argue that Bitcoin cycles are accelerating, you need more than a shorter ATH-to-ATH interval. You need to show a consistent acceleration in the actual cycle structure — and the bottom-to-ATH data doesn’t show that.
1
10
1,294
You may not believe it, but honestly, the more charts I analyze, the more confirmations I keep finding that my prolonged bearish-cycle thesis for Bitcoin is actually starting to play out exactly as expected.
$BTC
$XAU/ $BTC — the long-term curve structure may finally be breaking.
Look at the compression in the trend angles over the entire history.
In the previous cycles, XAU/BTC consistently made meaningful new ATL lows. But in the latest cycle, instead of producing another significant breakdown, it only made a marginal sweep before creating a new ATL.
Why?
Because the long-term trend angle has compressed almost to zero — around 0.3%.
That is an important structural change.
After years of declining trend angles and repeated new ATL formations, XAU/BTC is now showing early signs that the long-term downtrend may finally be transitioning into a reversal.
If this structure continues to play out, we could see XAU/BTC make a new cycle high during the current cycle, potentially while Bitcoin is still in its broader bear phase.
And this is where the structure becomes especially interesting:
XAU/BTC potentially makes its first major high → Bitcoin reaches its true cycle bottom → Bitcoin enters a new bull phase → XAU/BTC begins declining again.
However, this time I would not necessarily expect XAU/BTC to make another meaningful ATL.
Why could XAU/BTC finally make a new high?
Because the latest ATL was barely a new low — essentially a sweep after years of trend-angle compression.
The structure is telling us something has changed.
So logically, the first major objective during this cycle could be a move toward the previous major high, with the possibility of a sweep above it before the next major reversal.

1
7
1,263
$XAU/ $BTC — the long-term curve structure may finally be breaking.
Look at the compression in the trend angles over the entire history.
In the previous cycles, XAU/BTC consistently made meaningful new ATL lows. But in the latest cycle, instead of producing another significant breakdown, it only made a marginal sweep before creating a new ATL.
Why?
Because the long-term trend angle has compressed almost to zero — around 0.3%.
That is an important structural change.
After years of declining trend angles and repeated new ATL formations, XAU/BTC is now showing early signs that the long-term downtrend may finally be transitioning into a reversal.
If this structure continues to play out, we could see XAU/BTC make a new cycle high during the current cycle, potentially while Bitcoin is still in its broader bear phase.
And this is where the structure becomes especially interesting:
XAU/BTC potentially makes its first major high → Bitcoin reaches its true cycle bottom → Bitcoin enters a new bull phase → XAU/BTC begins declining again.
However, this time I would not necessarily expect XAU/BTC to make another meaningful ATL.
Why could XAU/BTC finally make a new high?
Because the latest ATL was barely a new low — essentially a sweep after years of trend-angle compression.
The structure is telling us something has changed.
So logically, the first major objective during this cycle could be a move toward the previous major high, with the possibility of a sweep above it before the next major reversal.
3
1
8
1,804
GM.
I believe the top is in — $87K was the top.
Everything happening on the lower timeframes right now is just noise before the real chaos begins.
$BTC
$BTC : Relief Rally Comparison:
Historically Three relief rallies appeared before major bearish continuation and the true cycle bottom.
But instead of looking only at the number of rallies, let’s compare their size and proportions.
2022 structure:
Wave (B): +25%
Wave (X): +30%
Wave (B): +39.5%
The third relief rally, marked with Wave (B), was 9.5 percentage points larger, or approximately 31.7% larger, than Wave (X).
Current structure:
Wave (B): +21%
Wave (X): +37%
Wave (B): +49%
The third relief rally, marked with Wave (B), is 12 percentage points larger, or approximately 32.4% larger, than Wave (X).
And this is the part I find particularly interesting:
In both structures, the third relief rally — Wave (B) — is roughly 32% larger than the second relief rally, Wave (X).
2022: 30% → 39.5% = +31.7% larger
Current: 37% → 49% = +32.4% larger
That is a surprisingly similar relationship.
So we’re not simply seeing the same sequence repeating. The current bearish-cycle structure appears to be developing on a larger scale and over a longer period, while the relative size of the relief rallies is showing a very similar pattern.
And based on this logic and calculation, it is very possible that the top of the current relief rally is already in.
If this structure continues to develop in a similar way, we could see major bearish continuation starting from here, eventually leading into the true cycle bottom in the coming months.

14
3
29
2,604
$DXY — the structure is getting very interesting.
Looking at the previous structures, we can identify two major completed upward impulses:
Structure 1 → +48%
Structure 2 → +28%
Structure 3 → expecting potentially +19%
What stands out is that all three structures have been developing in a remarkably similar way, while the size of each upward impulse has progressively decreased.
48% → 28% → expecting potentially ~19%
Because the current structure continues to develop in a similar manner to the previous ones, I expect another upward impulse, with my projection being around +19%.
If this pattern continues to play out, that potential +19% move could bring DXY into the 114-115$ area.
The key point is not simply the percentage targets — it’s the way the entire structures are developing similarly.

3
1
14
1,740
I realise that only a few of you currently believe my $ETH thesis, and maybe some of you are already tired of seeing my posts about it.
But simply give the market time.
The real chaos is still ahead.
$ETH true cycle bottom at early 2027:
If you remember, I’ve mentioned that ETH is essentially developing the same structure we saw during 2021–2022, but this time on a scale roughly 40% larger. This structural comparison is the foundation of my thesis.
I’ve already explained my bottom target in my previous post, so this one is more focused on timing. Let’s first take a closer look at the 2021–2022 structure.
During the 2021–2022 structure, Phase 1 lasted 112 days. After Phase 1 was completed, ETH formed an aggressive relief rally before entering Phase 2 — the major corrective phase that ultimately led to the true cycle bottom.
What’s important here is that Phase 2 also took roughly another 112 days, measured from the local bottom that initiated the relief rally until the eventual cycle bottom.
So we had:
Phase 1 → 112 days
Phase 2 → another 112 days
Now let’s apply the same structural relationship to the current 2025–2027 structure.
This time, the structure is approximately 40% larger, which means the corresponding phases and impulses are also taking significantly more time to develop.
In the current structure, Phase 1 has already taken approximately 280 days.
If the same proportional relationship continues to play out, then Phase 2 should logically take another ~280 days, measured from the local bottom around $1,500 and including the aggressive relief-rally period that has taken ETH as high as $2,800 so far, before the final cycle bottom is formed.
That would put the potential final bottom around March 2027.
And this is particularly interesting because it aligns with the timeframe I’ve been expecting for Bitcoin as well.
I’ve mentioned before that I’m expecting Bitcoin’s final cycle bottom to develop around early 2027.
So once again, the interesting part isn’t the exact date — it’s the structural symmetry and proportional timing between the previous and current ETH structures.

3
2
30
2,781
Well guys, you can see it for yourselves. The prolonged bearish cycle I’ve been talking about since the beginning is now starting to show signs of confirmation — not only on the higher timeframes, such as the monthly, but increasingly on the lower timeframes as well.
The more we progress, the more the market structure appears to be aligning with the thesis I’ve been outlining for months. It genuinely looks like the market is starting to confirm the structure I’ve been expecting.
And now I’m posting my $BTC thesis chart once again, so you can compare its timing with the $ETH setup from my quoted post.
Look closely at both structures — the timing similarities are becoming increasingly interesting.
$BTC $ETH

$ETH true cycle bottom at early 2027:
If you remember, I’ve mentioned that ETH is essentially developing the same structure we saw during 2021–2022, but this time on a scale roughly 40% larger. This structural comparison is the foundation of my thesis.
I’ve already explained my bottom target in my previous post, so this one is more focused on timing. Let’s first take a closer look at the 2021–2022 structure.
During the 2021–2022 structure, Phase 1 lasted 112 days. After Phase 1 was completed, ETH formed an aggressive relief rally before entering Phase 2 — the major corrective phase that ultimately led to the true cycle bottom.
What’s important here is that Phase 2 also took roughly another 112 days, measured from the local bottom that initiated the relief rally until the eventual cycle bottom.
So we had:
Phase 1 → 112 days
Phase 2 → another 112 days
Now let’s apply the same structural relationship to the current 2025–2027 structure.
This time, the structure is approximately 40% larger, which means the corresponding phases and impulses are also taking significantly more time to develop.
In the current structure, Phase 1 has already taken approximately 280 days.
If the same proportional relationship continues to play out, then Phase 2 should logically take another ~280 days, measured from the local bottom around $1,500 and including the aggressive relief-rally period that has taken ETH as high as $2,800 so far, before the final cycle bottom is formed.
That would put the potential final bottom around March 2027.
And this is particularly interesting because it aligns with the timeframe I’ve been expecting for Bitcoin as well.
I’ve mentioned before that I’m expecting Bitcoin’s final cycle bottom to develop around early 2027.
So once again, the interesting part isn’t the exact date — it’s the structural symmetry and proportional timing between the previous and current ETH structures.
4
23
2,091
$ETH true cycle bottom at early 2027:
If you remember, I’ve mentioned that ETH is essentially developing the same structure we saw during 2021–2022, but this time on a scale roughly 40% larger. This structural comparison is the foundation of my thesis.
I’ve already explained my bottom target in my previous post, so this one is more focused on timing. Let’s first take a closer look at the 2021–2022 structure.
During the 2021–2022 structure, Phase 1 lasted 112 days. After Phase 1 was completed, ETH formed an aggressive relief rally before entering Phase 2 — the major corrective phase that ultimately led to the true cycle bottom.
What’s important here is that Phase 2 also took roughly another 112 days, measured from the local bottom that initiated the relief rally until the eventual cycle bottom.
So we had:
Phase 1 → 112 days
Phase 2 → another 112 days
Now let’s apply the same structural relationship to the current 2025–2027 structure.
This time, the structure is approximately 40% larger, which means the corresponding phases and impulses are also taking significantly more time to develop.
In the current structure, Phase 1 has already taken approximately 280 days.
If the same proportional relationship continues to play out, then Phase 2 should logically take another ~280 days, measured from the local bottom around $1,500 and including the aggressive relief-rally period that has taken ETH as high as $2,800 so far, before the final cycle bottom is formed.
That would put the potential final bottom around March 2027.
And this is particularly interesting because it aligns with the timeframe I’ve been expecting for Bitcoin as well.
I’ve mentioned before that I’m expecting Bitcoin’s final cycle bottom to develop around early 2027.
So once again, the interesting part isn’t the exact date — it’s the structural symmetry and proportional timing between the previous and current ETH structures.
I think the weekly $ETH chart will help you understand how I’m counting the current structure and why I believe it is closely repeating the structure ETH developed in 2022.
The main difference is scale: the current structure is roughly 40% larger than the 2022 structure. Because of that, I’m assuming the corresponding upside and downside moves should also be proportionally larger. ( look
At quoted post )
In the 2022 structure, ETH experienced a strong relief rally of approximately +55% from the local lows.
So, if the current structure is ~40% larger, I scaled that move accordingly:
55% × 1.40 ≈ 77%
That projection pointed toward the $2,660 area.
And this is exactly what happened — ETH swept the $2,660 range almost perfectly, followed by an immediate rejection.
For me, this is another important piece of evidence that the current ETH structure is following the same underlying pattern as 2022, but on a larger scale.
2
23
5,819