

Baruch College, MBA 2023 Union College, BSc EE 2015 CFA L2 Candidate 2025
New York, NY
- Tweets 11,480
- Following 1,562
- Followers 939
- Likes 56,827


JP van Essche retweeted

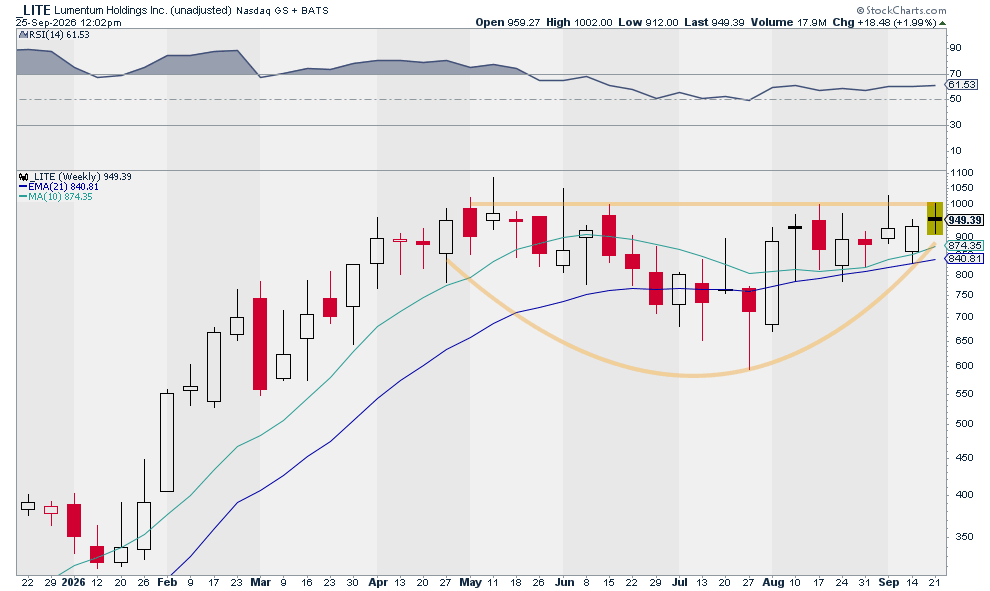
Don't sleep on $LITE
Daily chart is a chop fest. But weekly chart is super primed.
Next big runner imo
8
8
116
6,452
JP van Essche retweeted

The percentage of stocks above their 50-day SMA in my universe has fallen below 30%.
The last time we saw breadth this weak was back in March.
I’m not saying we’ve bottomed, but it certainly feels like we could be getting close, which is why I remain optimistic.
Important context: in March, breadth stayed persistently weak for several weeks before things finally turned.
Weak breadth can stay weak. I’m not trying to call the exact bottom, just recognizing that we’re reaching levels where I want to be increasingly alert for one.


22
14
353
36,583
JP van Essche retweeted

Nasdaq Composite
Big constructive base from the April low.
Broke the downtrend across the June and August highs. Now pulling back as the right side builds under the highs.
If this pullback holds, this is where I want to own leadership before it moves out.
Feels like 2019 chop mixed with the 1995 post rate-hike setup. Back then it was the internet. Today it’s AI.
Let’s goooo

8
12
127
8,584


RT @market_sleuth: Crazy but true. If 94% of the stocks in the S&P 500 went to ZERO leaving only the highest market cap stocks (top 6%) the…
114
1


JP van Essche retweeted

I don’t like the look of this. The yield curve is bear flattening - 2yr rising faster than the 10yr.
If this continues, inversion will happen.

15
3
141
16,793

Very few instances where indexes near ATHs and underlying metrics continue lower in terms of breadth.
Good news is they are getting stretched to the downside.
Bad news is this is incredibly confusing.
Only option I see is hide in the top leadership stocks and wait for them to kick you out of them.
Follow the leaders?
11
6
179
12,261
JP van Essche retweeted
Ugly breadth. New lows beating new highs. Under half of $SPX above its 200-day.
Meanwhile the leaders keep printing breakouts.
It is a strange setup. Not clean. But this is often how stronger markets look mid-climb: index noise, thin participation, and the best names still getting paid.
Focus stays on what is working, not on how weak the average stock looks.


10
10
166
11,708

$SPX breadth is down 8 days in a row. @WhiteHouse needs to focus on getting yields down
1
189
JP van Essche retweeted

What is T2108?
A simple breadth indicator.
The % stocks above 40-day SMA.
But why is it important?
2/n

1
4
10
4,687
JP van Essche retweeted

I've never seen this before in all my years trading and going back historically, I can't see a similar set up. T2108 below 25 with the QQQ 1% off ATHs.
Can anyone find anything similar historically?
59
13
376
53,253

Only 28% of S&P Stocks are currently above the 50 day with breadth near the late March lows. $SPX
32
