Empowering Traders, Analysts, and Portfolio Managers to discover unique market opportunities with powerful software and valuable education.

Brisbane, Australia
$SPX breadth continues to deteriorate. On Tuesday the index was flat with 249 stocks advancing and 253 declining. Today was flat again, but there were only 176 advancing and 326 declining:
1
1
11
2,081
Optuma retweeted
Today is September 22. According to historical seasonality, we’re entering the ugliest stretch of the month. Seasonality is context, not a signal. Let’s see which way the wind blows. $SPX $SPY $QQQ @Optuma
3
11
104
19,706
Despite the $SPX having its best day since August 4th, there were more stocks making new lows than highs: -> 31 new 1 Month highs 130 new lows -> 13 new 3 Months highs 68 new lows -> 7 new 12 Month highs 29 new lows It's been a similar story for the last few weeks:
1
1
7
3,899
More breadth weakness: 10% of $SPX stocks on Wednesday had an RSI(14) below 30. On Sept 1st there were twice as many stocks below 30 than above 70:
2
917
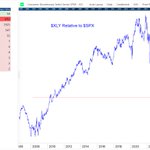
$XLK was the only sector beating the $SPX today, making a 54 day relative high. On the downside, $XLRE made an all-time relative low, , and 15 year low for $XLY:
2
10
1,008
Our new 'sunburst' chart shows sector and industry performance as concentric rings, allowing you to easily drill down to see what's moving:
1
13
971
For the 1st time since early April, less than half of the $SPX stocks are above their 200MA (and only 30% above their 50MA).
2
16
1,317
The 37 point loss (-0.48%) in $SPX today can be attributed to just 3 chip stocks: $NVDA -20.5 points $AVGO -9.5 points $MU -6.7 points As a sector, $XLK is still leading the index on a Relative Rotation Graph basis, but heading in a SW direction towards Weakening:
1
2
8
1,263
With 30 $SPX stocks crossing below their 50MA today (incl $AAPL) & only 3 crossing above, the % of members > 50MA has dropped to 37%:
2
12
1,357
Sure, Breadth has waned a tad in the last month, but honestly, Utilities, REITS, Staples going down DOESN'T concern me.. RUSSELL 3k A/D still at the highest levels in years.. This "AINT" late 2021, nor 2018, early 2025, nor 2026. Chart from #OPTUMA @Optuma
1
6
89
15,494
Historically, September is the worst month for the solana:J3NKxxXZcnNiMjKw9hYb2K4LUxgwB6t1FtPtQVsv3KFr, averaging, -0.6% and positive only 45% of the time. Of the sectors, $XLU is positive in Sept 63% of the time, but the avg gain is only 0.07%. Monthly averages & % Time Up:
1
1
5
1,623
Here's the average September performance for solana:J3NKxxXZcnNiMjKw9hYb2K4LUxgwB6t1FtPtQVsv3KFr by day. Performance turns negative after the 21st (around the equinox).
1
489
The last 3 days of August had more solana:J3NKxxXZcnNiMjKw9hYb2K4LUxgwB6t1FtPtQVsv3KFr members declining than advancing whilst the index gained slightly. This divergence sees the Breadth Thrust indicator (10EMA of (Adv / Adv+Dec)) crossing below 45 for the 1st time since May.
7
1,150
The solana:J3NKxxXZcnNiMjKw9hYb2K4LUxgwB6t1FtPtQVsv3KFr hasn't been more than 5% from its high since April 7th (100 trading days).
3
1
15
1,822
The solana:J3NKxxXZcnNiMjKw9hYb2K4LUxgwB6t1FtPtQVsv3KFr index gained 0.7% yesterday, but only 152 stocks gained on the day. $NVDA had its best day since April 2025 (+8.7%) which - at 7.8% of the index - accounted for nearly all the index's 55 point gain. There's not much green outside of tech on our new heatmap:
3
908
Only 4 of the biggest 10 $SPX stocks are beating the index YTD. $MU is beating by 185%, with $TSLA underperforming by 30%, & $META -24%.
1
5
1,246
Same list sorted by YTD SPX outperformance:
428
Of the 19 new 52 week highs in the $SPX today, 16 were in Health Care (there were no 52 week lows).
5
1,000
$CBRS gapped up above its average volume-weighted price from IPO:
1
1
6
1,976
38 $SPX stocks gained > 10% this week, the most since the rebound off the March low:
1
10
9,644