devtoolstips.org just got a face lift!
Now with:
✅ A home page that actually says what the site is about  ✅ A persistent sidebar to quickly access collections of tips. ✅ A persistent search field to find other tips.
Concerned about your privacy on the web?
You can use DevTools to check if the website you're visiting uses third-party cookies 🍪🥠
➡️ devtoolstips.org/tips/en/det…
ALT Chrome DevTools' Application tool, showing the cookies section containing a bunch of third-party websites
💡 You can customize the way objects are displayed in the Console and when debugging JavaScript in DevTools!
Even better, this now also works in Firefox, in addition to Chrome and Edge.
Learn all about creating your own custom object formatters at devtoolstips.org/tips/en/cus…
ALT Firefox with DevTools opened on the side, showing the Console tool with a list of logs. Each log contains a color object that's been rendered by a custom formatter.
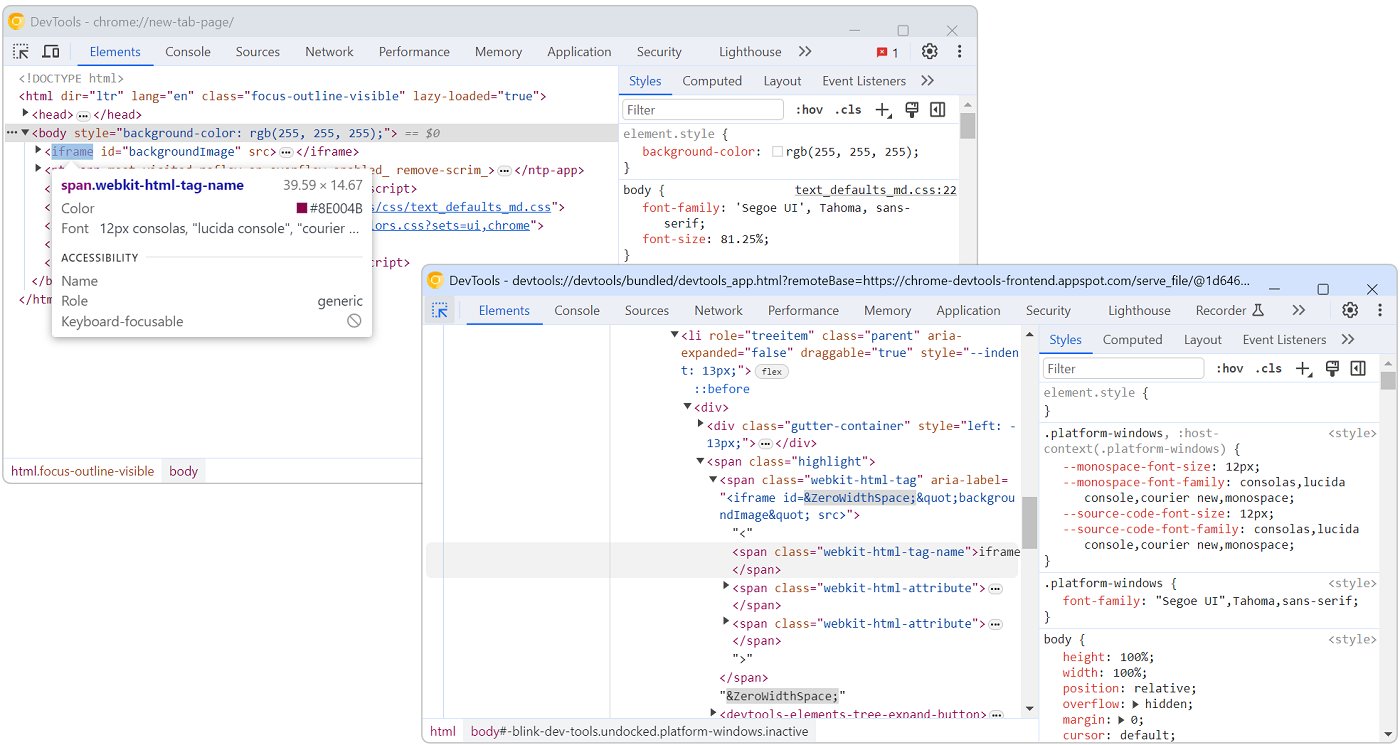
Inception of the DevTools 😵💫
You can inspect DevTools with DevTools. Yes, you heard right! A new DevTools window that inspects and debugs the first one.
After all, the DevTools UI is all HTML, CSS, JS, so why not?
Learn how ➡️ devtoolstips.org/tips/en/ins…
ALT Two Chrome DevTools windows, the first one inspects a webpage, the second one inspects the first one
Tired of the default DevTools themes? Have a creative idea for a custom theme of your own 💡?
You can load custom stylesheets in DevTools by creating a browser extension 🖌️
Learn more ➡️ devtoolstips.org/tips/en/cre…
ALT Chrome DevTools showing a custom theme where attribute names in the Elements tool are bolded
I know, the Memory tool 💾 can look quite intimidating.
But, hear me out!
If you're looking for a memory leak, record 2 snapshots, and use the comparison feature. This helps focus on what changed only and filters out the noise! 🤫
➡️ Learn more: devtoolstips.org/tips/en/fin…
ALT Microsoft Edge, with a demo webpage, and DevTools on the side with the Memory tool showing 2 snapshots have been recorded
Your friendly browser DevTools teams depend on your feedback to work on the right things!
Let them know about your bugs, or special needs! 🗣️💬
Here's how ➡️ devtoolstips.org/tips/en/sen…
The Console in DevTools can appear in its own tab, or at the bottom, below another tool you're already using.
If you get confused by this and don't know how things really work, take a read at our latest tip:
🔗 devtoolstips.org/tips/en/und…
ALT DevTools, with the main area at the top, and the drawer at the bottom, showing the Console tool.
Want to know which font was used in a long list of fallback in a font-family?
Firefox's got your back! It nicely underlines the font that was used in the Rules sidebar!
Learn more about it, and the difference between defined and rendered fonts here
devtoolstips.org/tips/en/see…
ALT Firefox, DevTools is opened on the side, showing the Inspector tool and the Rules sidebar tab. The font-family property shows a long list of fonts, with one of them being underlined
Need to debug your demo on CodePen, JSFiddle, or Glitch? Tired of having to find the right iframe?
Did you know you could re-target DevTools to an iframe!
Learn how 🔗 devtoolstips.org/tips/en/ins…
ALT Firefox, with DevTools opened on the side, showing the iframe selector button in the toolbar
Do you often take screenshots of webpages with DevTools?
Here is a cool tip to take super high resolution screenshots 📷📷📷
1. Use the :screenshot command in Firefox and set --dpr.
2. Use Device Mode in Chrome/Edge and set width/height.
Learn more ➡️ devtoolstips.org/tips/en/tak…
Hey console fans!
What do you do when you have tons of objects to log? You use console.table!
But there's more: you can customize the properties that get displayed!
Simply pass an array of strings as the second argument to console.table.
Learn more 🔗 devtoolstips.org/tips/en/cus…
ALT Example of a console.table output in Chrome DevTools showing just a few specific columns
Making your webpage printable? 🖨️
You probably don't want to print an actual paper sheet every time you test something, right? 🌳🌲
DevTools' got your back! Follow this simple tip to test and debug your print styles with DevTools
🔗 devtoolstips.org/tips/en/deb…
📏📐 Measure arbitrary distances and dimensions in the page with this awesome Firefox DevTools feature
➡️ devtoolstips.org/tips/en/mea…
ALT Firefox with DevTools docked on the side. The measure tool icon is in the DevTools toolbar and has been clicked. An arbitrary area has been defined on the page and its dimensions are displayed in a tooltip
Want to help us make an even better DevTools Tips website?
Have 2 minutes to spare?
Then please consider filling in this very short survey!
forms.gle/1rhvKkwfAjs3ATqJ8
💘💝💖💗💓💞
Working on a backend service can be tedious if you have to refresh the webpage that's calling it every time you make a change.
✨ With DevTools, you don't have to ✨
▶️ Replay XHR: devtoolstips.org/tips/en/rep…
▶️ Edit and resend any request: devtoolstips.org/tips/en/edi…
ALT Chrome's Network tool, with the Replay XHR contextual menu item
The fastest code is the code that doesn't run 🏃♀️🏃🏾♀️
Well, if it doesn't run, then why load it?
With DevTools, it's easy to detect which parts of your CSS and JS code don't run.
➡️ devtoolstips.org/tips/en/det…
This way you can defer loading the unused parts until they're needed 💡
Your users don't have your dev PC! They have a low-end mobile devices with a slow CPUs and unstable network.
Build empathy! Test your app under their conditions!
DevTools can help:
🐌 Throttle your CPU devtoolstips.org/tips/en/thr…
🐌 Throttle your network devtoolstips.org/tips/en/thr…