

computers can be understood • DMs open (but responsiveness varies) • she/her, ⚢
- Tweets 7,166
- Following 23
- Followers 12,964
- Likes 4,378


ALT calvin’s dad: hey check this out. all languages are lisp or haskell. java? lisp. c++? haskell. javascript? lisp. rust? you might think it’s lisp because of the macros, but it’s actually haskell


ALT Post on bsky by @slothropsmap.bsky.social: I keep an informal little equation in my head at all times: irony-poisoned → low trust → fascism I don’t care if it’s cringe. You have to believe in things, earnestly, to acknowledge that progress is happening and better things yet remain. Your “lol, lmao” at every little thing is death.


ALT Creates a new pict by aligning the descent and ascent lines of each adjacent pair of picts. That is, each pict is vertically positioned such that its ascent line (as reported by pict-ascent) is aligned with the previous pict’s descent line (as reported by pict-descent). Each pict is horizontally positioned so that it immediately follows the previous pict’s last element (as reported by pict-last). The alignment rules used by line-append make it useful for aligning multiline blocks, especially code that uses expression-based indentation. Examples: > (define (tt str) (text str 'modern 16)) > (line-append (vl-append (tt "(define some-example-with-a-long-first-line") (tt " (values ")) (vl-append (tt "(some-expression)") (tt "(another-expression)") (tt "note-the-close-paren!")) (tt ")"))
![Toolbox: Miscellaneous Utilities
This library provides a collection of miscellaneous Racket utilities that I use in my personal projects but I have not felt warrant being published as a separate package. Note that this library is intentionally not published on the Racket package server, as everything in this library should be considered unstable. In projects that use it, I include this repository as a Git submodule, pinning to a specific version.
[table of contents]](/pic/orig/media%2FGbZl-Iva4AAJRE_.jpg)
ALT Toolbox: Miscellaneous Utilities This library provides a collection of miscellaneous Racket utilities that I use in my personal projects but I have not felt warrant being published as a separate package. Note that this library is intentionally not published on the Racket package server, as everything in this library should be considered unstable. In projects that use it, I include this repository as a Git submodule, pinning to a specific version. [table of contents]

ALT Alexis King: Just because your other question was more on-topic here than wherever you initially asked it (though it doesn’t seem to have been migrated to me?) doesn’t mean other questions are, too! Please read the help center to see what sorts of questions we focus on here. AlMa1r: Just because you feel an urge to exercise control but have no real control doesn't mean you should complain about every single closed question in retrospect. Please consult your soul before commenting.

ALT photograph of a woman crossing the street

ALT photograph of an alley

ALT photograph of a reflective pool of water in a public park

ALT 5.4 Examples With moral equality defined we can prove a number of laws

![[discord screenshot]
xolopitli: im just trying to make server requests using modern web technologies
xolopitli: it's not working](/pic/orig/media%2FGBMTvm_WcAAJcMT.jpg)
ALT [discord screenshot] xolopitli: im just trying to make server requests using modern web technologies xolopitli: it's not working


ALT screenshot of the “Guarantees” section of the documentation for my Racket MVars library


ALT Screenshot of the M-vars documentation, which is too long for alt text but is linked from the tweet. The first paragraph is “An M-var is a mutable data structure useful in concurrent programs. Like a box, an M-var is a mutable reference cell that can hold a single value. Unlike a box, an M-var can also be empty, holding no value at all. When a value is placed into an empty M-var using mvar-put!, the M-var becomes full, and it remains full until the value is removed using mvar-take!. If a thread attempts to put a value into an M-var that is already full, the thread waits until the M-var is emptied. Dually, if a thread attempts to take a value from an M-var that is currently empty, it waits until the M-var is filled.”
ALT Screenshot of the M-vars documentation, which is too long for alt text but is linked from the tweet. The first paragraph is “An M-var is a mutable data structure useful in concurrent programs. Like a box, an M-var is a mutable reference cell that can hold a single value. Unlike a box, an M-var can also be empty, holding no value at all. When a value is placed into an empty M-var using mvar-put!, the M-var becomes full, and it remains full until the value is removed using mvar-take!. If a thread attempts to put a value into an M-var that is already full, the thread waits until the M-var is emptied. Dually, if a thread attempts to take a value from an M-var that is currently empty, it waits until the M-var is filled.”
![;; Wraps `contract-pos/neg-doubling` in an API that doesn’t make me want to die.
(define (build-pos/neg-val-projection pos-thunk neg-thunk make-val-proj)
(define-values [filled? maybe-pos maybe-neg]
(contract-pos/neg-doubling (pos-thunk) (neg-thunk)))
(cond
[filled?
(make-val-proj maybe-pos maybe-neg)]
[else
(define val-proj
(λ (val neg-party)
(define proj (make-val-proj (maybe-pos) (maybe-neg)))
(set! val-proj proj)
(proj val neg-party)))
(λ (val neg-party)
(val-proj val neg-party))]))](/pic/orig/media%2FF_q07v8W8AAtatT.jpg)
ALT ;; Wraps `contract-pos/neg-doubling` in an API that doesn’t make me want to die. (define (build-pos/neg-val-projection pos-thunk neg-thunk make-val-proj) (define-values [filled? maybe-pos maybe-neg] (contract-pos/neg-doubling (pos-thunk) (neg-thunk))) (cond [filled? (make-val-proj maybe-pos maybe-neg)] [else (define val-proj (λ (val neg-party) (define proj (make-val-proj (maybe-pos) (maybe-neg))) (set! val-proj proj) (proj val neg-party))) (λ (val neg-party) (val-proj val neg-party))]))


![[discord screenshot]
lexi: djm is focusing 100% of his mental energy into respecting women
pierre connard: the only man who can use 100% of his brain
djm: my productivity is basically zero](/pic/orig/media%2FF92e0sCW4AAmEWw.jpg)
ALT [discord screenshot] lexi: djm is focusing 100% of his mental energy into respecting women pierre connard: the only man who can use 100% of his brain djm: my productivity is basically zero

ALT Haskell logo surrounded by circle captioned “Runtime System” in the style of the Bell System logo, with NTSC filter applied.

ALT photo of two people at the far end of a bar

ALT the lineup of SRC competitors

ALT Simon Peyton Jones introducing the Haskell Implementors’ Workshop

ALT the ICFP lunch crowd


ALT photo of several ICFP attendees at a bar

ALT photo of a row of the ICFP audience

ALT photo of numerous ICFP attendees attempting to connect a Linux laptop to a projector

ALT photo of Ferris the crab (and his assistant) manning the A/V booth

ALT addMaybe :: Int -> Maybe Int -> Int addMaybe _ Nothing = error "addMaybe: nothing to add" addMaybe x (Just y) = x + y val :: Int val = addMaybe (error "bang") Nothing

ALT photograph of me
ALT addMaybe :: Int -> Maybe Int -> Int addMaybe _ Nothing = error "addMaybe: nothing to add" addMaybe x (Just y) = x + y val :: Int val = addMaybe (error "bang") Nothing

ALT photograph of me wearing new glasses


ALT 3.3 Reincarnation, Schizophrenia, and Correct Binding

ALT Chart of my sleep from November 2022 through June 2023. The pattern consistently drifts forwards by a few hours each day for most of the range.

ALT Plot of all of my time spent asleep over the past 6 months or so. The results are somewhat normal during October and early November, but highly unusual everywhere else: there is a very visible pattern of constant forward drift.

ALT lexi: it feels sort of wasteful to copy around the whole stack but memcpy go brrr rpjohnst: probably can amortize it too lexi: you mean just in the sense of the usual size doubling scheme? rpjohnst: yeah lexi: yeah pretty much chc4: memcpy is really fast chc4: its stupid chc4: they should make it slower imo lexi: Computing Balance Patch 1.72.6 • memcpy’s throughput has been reduced by 20% to encourage viability of more exotic data structures. • Increased branch misprediction chance by 2% on small workloads to compensate for increased memory sizes. • Lowered overclocking error rate by 15% to reduce the dominance of fast ECC RAM play. • Introduced a very small (<1%) probability of permanent hardware damage for buffer overruns, but increased the cost of bounds checks by 50%. • Removed the FJCVTZS instruction.

ALT screenshot of the “answers” tab of my profile on langdev stack exchange

ALT lexi: OH NO https://langdev.stackexchange.com rpjohnst: r/pl is leaking we've lost containment

ALT glowcoil: it's going to be bad lexi: IT’S ALREADY BAD https://langdev.stackexchange.com/questions/698/why-does-rust-have-an-infinite-loop-construct aji: bikeshed.stackexchange.com


ALT Screenshot of old newspaper editorial that says: “CHEER UP. In the midst of a calamity without parallel in the world’s history, looking upon the ashes of thirty years’ accumulations, the people of this once beautiful city have resolved that CHICAGO SHALL RISE AGAIN”

ALT Screenshot of slide with title “Terminology” and contents: (crossed out) “continuations” followed by “native, first-class, delimited continuations”.

ALT Screenshot of slide showing decomposition of expression into redex and contination.


ALT lexi: programmers are so ready to point their fingers at stuff they don’t immediately understand and call it “unreadable” lexi: where programmers learn a bunch of stuff and then once they get good enough at it decide they should never have to learn any more things lexi: programmers get angrier about people moving their cheese than like any other group of skilled professionals I know

ALT lexi: programmers stop treating not-particularly-complex systems they don’t understand as if they were black magic challenge

ALT lexi: I genuinely think it says a lot about haskell programmers that they will think their type system means they’re doing formal methods yet half their libraries use arbitrary bytevectors to represent text lexi: I don’t think haskell programmers will ever understand how strings work. I don’t understand how they’re so bad at this but I gave up on this a while ago

ALT lexi: programmers have been on record as hating fortran, hating structured programming, hating functional programming, hating lexical closures, hating static analysis, lexi: yeah, unfortunately from reading a lot of PL history you also learn that, overwhelmignly, programmers hate progress and actively work against it

ALT screenshot of https://github.com/search?o=desc&q=topic%3Aracket&s=stars&type=Repositories, with lexi-lambda/hackett circled, fourth in the list

ALT SQLite version 3.41.2 2023-03-22 11:56:21 Enter ".help" for usage hints. Connected to a transient in-memory database. Use ".open FILENAME" to reopen on a persistent database. sqlite> SELECT value, value FROM (SELECT random() AS value FROM (SELECT 1)); -2813549750941828763|-3098422291103919095
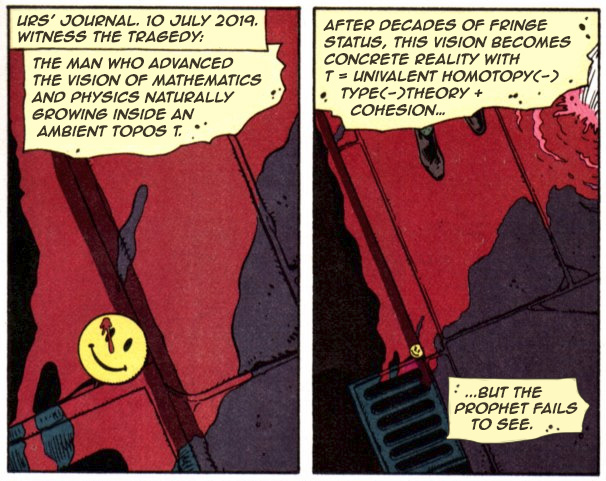
ALT Watchmen panels edited to contain the following text bubbles: Urs’ Journal. 10 July 2019. Witness the tragedy: The man who advanced the vision of mathematics and physics naturally growing inside an ambient topos T. After decades of fringe status, this vision becomes concrete reality with T = univalent homotopy(-)type(-)theory + cohesion… but the prophet fails to see.

ALT Watchmen panels edited to contain the following text bubbles: You are forbidden to adopt the nPov until you have proven your worth. It's taboo for the unenlighted masses who wander aimlessly, hurting them like the sun hurts the slug. It's the grace granted on those who dared and survived the passage through the veil of the 0-truncated world. When our 5yo shies away from the unfamiliar, I forbid her to touch it. Works wonders.

ALT Screenshot of a discord chat in which @riz0id writes “not absolving myself in anyway of not writing crank but my general observation is many high level posters adjacent to tla+ have a seemingly unintentional crank in the stuff they write analogous to how type theorist seemingly unintentionally come off as comic book villians,” then posts a screenshot of “Ornamental Algebras, Algebraic Ornaments” with the caption “this is super villain monologue”.

ALT A comic book monologue by Dr. Manhattan, photoshopped to replace the text with some of the text from the PDF, which reads, “If it is not a peculiar question, where do datatypes come from? Most programming languages allow us to declare datatypes—that is to say, datatypes come from thin air. Programs involving the data thus subsequently become admissible, and if we are fortunate, we may find that some of those programs are amongst those that we happen to want. The work I present here is an initial experiment with ornaments, where the native notion of datatype is now delivered via universe.”


ALT The code we generate is this: push arg push bogus-word

ALT Plaque that reads: “There is a period when it’s clear that you have gone wrong but you continue. Sometimes there is a luxurious amount of time before anything bad happens.”

ALT Screenshot of the “NonDet + Error” section of the linked document, which contains a table of semantics that differs significantly between implementations.

ALT Screenshot of the linked comment, which is much too long for Twitter alt text.

ALT Screenshot of the linked comment, which is much too long for Twitter alt text.

ALT Screenshot of the linked comment, which is much too long for Twitter alt text.

ALT Screenshot of the linked comment, much too long for Twitter alt text.

ALT Screenshot of the linked comment, much too long for Twitter alt text.

ALT Screenshot of the linked comment, much too long for Twitter alt text.

ALT Screenshot of the linked comment, much too long for Twitter alt text.

ALT lexi: men need to understand that the only important dating criteria are “is she hot” (they understand this part) and “does talking to her feel like a slow yet steady natural entangling of your souls” #1 ponyboy fan account: happy valentine's day to you too, lexi lexi: thanks crab 🥰

ALT screenshot of a GitHub notification that says “samth starred lexi-lambda/case-kw-lambda”
![$ cat bug.rkt
#lang racket
(module untyped racket
(provide a^)
(define-signature a^
[x
(define-values-for-export [x] 'not-a-pair)]))
(module typed typed/racket
(require/typed (submod ".." untyped)
[#:signature a^ ([x : (Pairof Integer Integer)])])
(define-unit get-x@
(import a^)
(export)
x)
(define v : (Pairof Integer Integer)
(invoke-unit get-x@ (import a^)))
(+ (car v) (cdr v)))
(require 'typed)
$ ./8.7/bin/racket bug.rkt
invalid memory reference. Some debugging context lost
context...:
body of (submod "/home/alexis/Downloads/racket/bug.rkt" typed)](/pic/orig/media%2FFoOsjDTWYAIeYF9.jpg)
ALT $ cat bug.rkt #lang racket (module untyped racket (provide a^) (define-signature a^ [x (define-values-for-export [x] 'not-a-pair)])) (module typed typed/racket (require/typed (submod ".." untyped) [#:signature a^ ([x : (Pairof Integer Integer)])]) (define-unit get-x@ (import a^) (export) x) (define v : (Pairof Integer Integer) (invoke-unit get-x@ (import a^))) (+ (car v) (cdr v))) (require 'typed) $ ./8.7/bin/racket bug.rkt invalid memory reference. Some debugging context lost context...: body of (submod "/home/alexis/Downloads/racket/bug.rkt" typed)
![$ cat bug.rkt
#lang typed/racket
(define-signature a^ ([x : (Pairof Integer Integer)]))
(define-unit get-x@
(import a^)
(export)
x)
(define v : (Pairof Integer Integer)
(let ()
(define-syntax (x stx)
#'(quote not-an-integer))
(invoke-unit get-x@ (import a^))))
(+ (car v) (cdr v))
$ ./8.7/bin/racket bug.rkt
644225852946515978
$ ./8.7/bin/racket bug.rkt
67765100643092482
$ ./8.7/bin/racket bug.rkt
+: contract violation
expected: number?
given: #<garbage>
context...:
body of "/home/alexis/Downloads/racket/bug.rkt"
$ ./8.7/bin/racket bug.rkt
+: contract violation
expected: number?
given: #<foreign>
context...:
body of "/home/alexis/Downloads/racket/bug.rkt"
$ ./8.7/bin/racket bug.rkt
invalid memory reference. Some debugging context lost
context...:
body of "/home/alexis/Downloads/racket/bug.rkt"](/pic/orig/media%2FFoLEKfsXEAAOS5Q.jpg)
ALT $ cat bug.rkt #lang typed/racket (define-signature a^ ([x : (Pairof Integer Integer)])) (define-unit get-x@ (import a^) (export) x) (define v : (Pairof Integer Integer) (let () (define-syntax (x stx) #'(quote not-an-integer)) (invoke-unit get-x@ (import a^)))) (+ (car v) (cdr v)) $ ./8.7/bin/racket bug.rkt 644225852946515978 $ ./8.7/bin/racket bug.rkt 67765100643092482 $ ./8.7/bin/racket bug.rkt +: contract violation expected: number? given: #<garbage> context...: body of "/home/alexis/Downloads/racket/bug.rkt" $ ./8.7/bin/racket bug.rkt +: contract violation expected: number? given: #<foreign> context...: body of "/home/alexis/Downloads/racket/bug.rkt" $ ./8.7/bin/racket bug.rkt invalid memory reference. Some debugging context lost context...: body of "/home/alexis/Downloads/racket/bug.rkt"
![let maybeKey: string | null = null;
const keys = ["a", "b"]
keys.forEach(key => {
maybeKey = key
});
let x: null = maybeKey;](/pic/orig/media%2FFoJn6q4WAAEWGHG.jpg)
ALT let maybeKey: string | null = null; const keys = ["a", "b"] keys.forEach(key => { maybeKey = key }); let x: null = maybeKey;
![11.1 Mainstream Type Systems for Dynamic Languages
TypeScript [2012] is a widely used typed superset of JavaScript. Like Flow, it aims to improve developer productivity by providing tooltips through IDEs. Unlike Flow, it focuses only on finding “likely errors” without caring about soundness [Bierman et al. 2014]. Type inference in TypeScript is mostly local and in some cases contextual; it doesn’t perform global type inference like Flow, so in general more annotations are needed. Whenever type annotations are missing, they are considered](/pic/orig/media%2FFoJjWiyXkAAxXcW.jpg)
ALT 11.1 Mainstream Type Systems for Dynamic Languages TypeScript [2012] is a widely used typed superset of JavaScript. Like Flow, it aims to improve developer productivity by providing tooltips through IDEs. Unlike Flow, it focuses only on finding “likely errors” without caring about soundness [Bierman et al. 2014]. Type inference in TypeScript is mostly local and in some cases contextual; it doesn’t perform global type inference like Flow, so in general more annotations are needed. Whenever type annotations are missing, they are considered
![#| Note [Signature runtime representation]
~~~~~~~~~~~~~~~~~~~~~~~~~~~~~~~~~~~~~~~~~~
At runtime, signatures largely do not exist: they are quite
second-class. But we do need a unique value to identify each
signature by, as the linker needs to be able to match up linkages
by their signature. No other information is necessary, so a gensym
per signature will do; we call this gensym the *signature id*.
However, two things complicate the story slightly:
1. Multiple linkages for the same signature can be distinguished
using tags.
2. Signatures support inheritance, which allows an import linkage
to be satisfied by an export linkage of a sub-signature.
The first point is managed easily by possibly combining each
signature gensym with a tag symbol, yielding the definition of a
*signature key*:
signature-id? = (and/c symbol? symbol-uninterned?)
tag-symbol? = (and/c symbol? symbol-interned?)
signature-key? = (or/c [alt text limit]](/pic/orig/media%2FFoJX532XoAErDJm.png)
ALT #| Note [Signature runtime representation] ~~~~~~~~~~~~~~~~~~~~~~~~~~~~~~~~~~~~~~~~~~ At runtime, signatures largely do not exist: they are quite second-class. But we do need a unique value to identify each signature by, as the linker needs to be able to match up linkages by their signature. No other information is necessary, so a gensym per signature will do; we call this gensym the *signature id*. However, two things complicate the story slightly: 1. Multiple linkages for the same signature can be distinguished using tags. 2. Signatures support inheritance, which allows an import linkage to be satisfied by an export linkage of a sub-signature. The first point is managed easily by possibly combining each signature gensym with a tag symbol, yielding the definition of a *signature key*: signature-id? = (and/c symbol? symbol-uninterned?) tag-symbol? = (and/c symbol? symbol-interned?) signature-key? = (or/c [alt text limit]
![Note [The unit invocation and linking protocol]
~~~~~~~~~~~~~~~~~~~~~~~~~~~~~~~~~~~~~~~~~~~~~~~
Unit invocation is a two-step process to support dynamic linking.
1. In the first phase, each unit’s `unit-go` thunk is applied,
which allocates and returns an *export table* for each of the
unit’s exported signatures, plus a procedure to be invoked in
the second phase.
2. In the second phase, an *import table* is assembled for each
unit from the export tables the unit is linked against, and
the procedure returned in the first phase is applied to this
import table to execute the unit body.
Each of these tables has the following shape:
ie-table/c = (hash/c signature-key?
(immutable-vectorof (-> any/c)))
Each signature key is mapped to a vector that contains a thunk for
each binding exported by the signature, which returns the binding’s
current value. This thunking is needed because the binding might be
[alt text limit]](/pic/orig/media%2FFoJXeCdWIAIsevD.png)
ALT Note [The unit invocation and linking protocol] ~~~~~~~~~~~~~~~~~~~~~~~~~~~~~~~~~~~~~~~~~~~~~~~ Unit invocation is a two-step process to support dynamic linking. 1. In the first phase, each unit’s `unit-go` thunk is applied, which allocates and returns an *export table* for each of the unit’s exported signatures, plus a procedure to be invoked in the second phase. 2. In the second phase, an *import table* is assembled for each unit from the export tables the unit is linked against, and the procedure returned in the first phase is applied to this import table to execute the unit body. Each of these tables has the following shape: ie-table/c = (hash/c signature-key? (immutable-vectorof (-> any/c))) Each signature key is mapped to a vector that contains a thunk for each binding exported by the signature, which returns the binding’s current value. This thunking is needed because the binding might be [alt text limit]
![Note [Linking for contracted imports and exports]
~~~~~~~~~~~~~~~~~~~~~~~~~~~~~~~~~~~~~~~~~~~~~~~~~
Signature bindings with contracts complicate the linking protocol in
two ways:
1. Assignment of negative blame depends on the unit that imports
the binding (and there many be multiple such units).
2. Contract expressions can depend on the value of signature
members, so evaluating them too early can trigger use-before-
initialization errors.
The first point is handled by simply adding another layer of
indirection: rather than returning the value directly, each binding’s
thunk returns a procedure of one argument that accepts the negative
blame party and returns the contracted value.
The second point is more subtle. It may seem like we ought to be able
to simply delay evaluating the contract expressions until the unit is
fully initialized, but this can cause values to be initialized too late
when recursive linking is involved. Consider the following [alt text limit]](/pic/orig/media%2FFoJXoKgXEAYi0TO.png)
ALT Note [Linking for contracted imports and exports] ~~~~~~~~~~~~~~~~~~~~~~~~~~~~~~~~~~~~~~~~~~~~~~~~~ Signature bindings with contracts complicate the linking protocol in two ways: 1. Assignment of negative blame depends on the unit that imports the binding (and there many be multiple such units). 2. Contract expressions can depend on the value of signature members, so evaluating them too early can trigger use-before- initialization errors. The first point is handled by simply adding another layer of indirection: rather than returning the value directly, each binding’s thunk returns a procedure of one argument that accepts the negative blame party and returns the contracted value. The second point is more subtle. It may seem like we ought to be able to simply delay evaluating the contract expressions until the unit is fully initialized, but this can cause values to be initialized too late when recursive linking is involved. Consider the following [alt text limit]
![This program should run successfully, but if we wait to attach contracts
until `b@` is fully initialized, then the call to `add-n` will fail when
it tries to evaluate `n`. On the other hand, we cannot simply attach
contracts immediately, as that would cause examples like this to fail:
(define-signature c^
[(contracted
[p? predicate/c]
[f (-> p? p?)])])
(define-unit c@
(import)
(export c^)
(define f add1)
(define p? number?))
We could demand that the user manually ensure that definitions in a
unit are initialized in such an order that this never causes trouble,
but this is difficult to reason about, especially when the author of a
signature and a unit that implements it are not the same person.
To accept both these programs, we accept a balance between the two
approaches: a contracted export is initialized as soon as its
corresponding definition is evaluated, but the contract expression
itself is evaluated [alt text limit]](/pic/orig/media%2FFoJXslXXwAAW2pO.png)
ALT This program should run successfully, but if we wait to attach contracts until `b@` is fully initialized, then the call to `add-n` will fail when it tries to evaluate `n`. On the other hand, we cannot simply attach contracts immediately, as that would cause examples like this to fail: (define-signature c^ [(contracted [p? predicate/c] [f (-> p? p?)])]) (define-unit c@ (import) (export c^) (define f add1) (define p? number?)) We could demand that the user manually ensure that definitions in a unit are initialized in such an order that this never causes trouble, but this is difficult to reason about, especially when the author of a signature and a unit that implements it are not the same person. To accept both these programs, we accept a balance between the two approaches: a contracted export is initialized as soon as its corresponding definition is evaluated, but the contract expression itself is evaluated [alt text limit]
![#| Note [Generated export definitions]
~~~~~~~~~~~~~~~~~~~~~~~~~~~~~~~~~~~~~~
The `define-values-for-export` form is used to generate a definition
in any unit that exports the signature. While the idea is conceptually
a natural dual to `define-values` in a signature (which synthesizes
definitions in units that *import* the signature), there are several
ways in which they work somewhat differently.
For one, identifiers bound by export definitions do not conflict with
other members of the signature. For example, this is entirely legal:
(define-signature sig^
[some-value
(define-values-for-export [some-value] 'something)])
There is no conflict because, of course, an `export` declaration
introduces *uses* of the signature members, not bindings for them. The
generated export supplies the value that is exported by the unit.
It is not currently possible for a user to suppress the generation of
these definitions when a signature is exported (though we sometimes [alt text limit]](/pic/orig/media%2FFoJWhC5XoAEnWK5.png)
ALT #| Note [Generated export definitions] ~~~~~~~~~~~~~~~~~~~~~~~~~~~~~~~~~~~~~~ The `define-values-for-export` form is used to generate a definition in any unit that exports the signature. While the idea is conceptually a natural dual to `define-values` in a signature (which synthesizes definitions in units that *import* the signature), there are several ways in which they work somewhat differently. For one, identifiers bound by export definitions do not conflict with other members of the signature. For example, this is entirely legal: (define-signature sig^ [some-value (define-values-for-export [some-value] 'something)]) There is no conflict because, of course, an `export` declaration introduces *uses* of the signature members, not bindings for them. The generated export supplies the value that is exported by the unit. It is not currently possible for a user to suppress the generation of these definitions when a signature is exported (though we sometimes [alt text limit]
![#| Note [Suppress generated exports on reexport]
~~~~~~~~~~~~~~~~~~~~~~~~~~~~~~~~~~~~~~~~~~~~~~~~
As described in Note [Generated export definitions] in
"exptime/signature.rkt", we normally always generate export definitions
in any unit that exports the signature. However, forms like `unit/c`
expand to a wrapper unit that simply invokes a subunit in its body and
reexports the resulting bindings. These subunits already include the
generated definitions, some of those definitions may in fact be exported,
so we don’t want to generate them again.
We therefore explicitly suppress generation of export definitions for
these forms by passing `#:suppress-generated-exports? #t` to
`build-unit`. This can have slightly surprising results if the export
definitions are not actually exported, such as in the following example:
(define-signature sig^
[value
(define-values-for-export [ctc] any/c)])
(unit/c
(import)
(export (sig^ [value ctc])))
This program is [alt text limit]](/pic/orig/media%2FFoJWzQoWQAIZFKT.png)
ALT #| Note [Suppress generated exports on reexport] ~~~~~~~~~~~~~~~~~~~~~~~~~~~~~~~~~~~~~~~~~~~~~~~~ As described in Note [Generated export definitions] in "exptime/signature.rkt", we normally always generate export definitions in any unit that exports the signature. However, forms like `unit/c` expand to a wrapper unit that simply invokes a subunit in its body and reexports the resulting bindings. These subunits already include the generated definitions, some of those definitions may in fact be exported, so we don’t want to generate them again. We therefore explicitly suppress generation of export definitions for these forms by passing `#:suppress-generated-exports? #t` to `build-unit`. This can have slightly surprising results if the export definitions are not actually exported, such as in the following example: (define-signature sig^ [value (define-values-for-export [ctc] any/c)]) (unit/c (import) (export (sig^ [value ctc]))) This program is [alt text limit]
![Note [No generated exports for unit/new-import-export]
~~~~~~~~~~~~~~~~~~~~~~~~~~~~~~~~~~~~~~~~~~~~~~~~~~~~~~
Currently, the `unit/new-import-export` form does not include generated
export definitions. This can be somewhat unintuitive, as `unit-from-context`
*does* generate these definitions, even though it also does not have an
explicit unit body. We suppress the definitions for two reasons:
1. The behavior is useful when some signatures are shared between
the original exports and the new exports, since in that case, the
form is just reexporting those signatures and the reasoning in
Note [Suppress generated exports on reexport] applies.
2. It’s how `unit/new-import-export` has historically worked, so
changing its behavior would be a backwards compatibility concern.
Note [Passing contracts to unit-body]
~~~~~~~~~~~~~~~~~~~~~~~~~~~~~~~~~~~~~
When we trampoline from `unit` to `unit-body`, we need to pass along
the contract expressions from the [alt text limit]](/pic/orig/media%2FFoJW7y4XEAUVWrI.png)
ALT Note [No generated exports for unit/new-import-export] ~~~~~~~~~~~~~~~~~~~~~~~~~~~~~~~~~~~~~~~~~~~~~~~~~~~~~~ Currently, the `unit/new-import-export` form does not include generated export definitions. This can be somewhat unintuitive, as `unit-from-context` *does* generate these definitions, even though it also does not have an explicit unit body. We suppress the definitions for two reasons: 1. The behavior is useful when some signatures are shared between the original exports and the new exports, since in that case, the form is just reexporting those signatures and the reasoning in Note [Suppress generated exports on reexport] applies. 2. It’s how `unit/new-import-export` has historically worked, so changing its behavior would be a backwards compatibility concern. Note [Passing contracts to unit-body] ~~~~~~~~~~~~~~~~~~~~~~~~~~~~~~~~~~~~~ When we trampoline from `unit` to `unit-body`, we need to pass along the contract expressions from the [alt text limit]
![#| Note [Parsed signature imports and exports]
~~~~~~~~~~~~~~~~~~~~~~~~~~~~~~~~~~~~~~~~~~~~~~
When we parse a signature import or export in a unit body, we return a
`signature-ie?` value. The value contains a reference to the original
`signature?` binding it imports or exports, but most of the signature
binding’s fields are also included in the `signature-ie?` value, in a
slightly modified form:
* Fields of `signature-ie?` have adjusted scopes based on the lexical
context of the signature identifier in the import/export spec.
* Fields containing imports come in a slightly different shape,
with each binding identifier split into an `int/ext?` pair:
int/ext? = (cons/c identifier? identifier?)
vars : (listof int/ext?)
val-defs : (listof (listof (cons/c (listof int/ext?) syntax?))
stx-defs : (listof (listof (cons/c (listof int/ext?) syntax?))
These split identifier pairs track both the internal and external
name of each [alt text limit]](/pic/orig/media%2FFoJXHuxXgAAevYT.png)
ALT #| Note [Parsed signature imports and exports] ~~~~~~~~~~~~~~~~~~~~~~~~~~~~~~~~~~~~~~~~~~~~~~ When we parse a signature import or export in a unit body, we return a `signature-ie?` value. The value contains a reference to the original `signature?` binding it imports or exports, but most of the signature binding’s fields are also included in the `signature-ie?` value, in a slightly modified form: * Fields of `signature-ie?` have adjusted scopes based on the lexical context of the signature identifier in the import/export spec. * Fields containing imports come in a slightly different shape, with each binding identifier split into an `int/ext?` pair: int/ext? = (cons/c identifier? identifier?) vars : (listof int/ext?) val-defs : (listof (listof (cons/c (listof int/ext?) syntax?)) stx-defs : (listof (listof (cons/c (listof int/ext?) syntax?)) These split identifier pairs track both the internal and external name of each [alt text limit]
