

Trader. Nature Lover. Chart enthusiast. Head of Technical Research & Strategy @SchwabResearch & Contributor @SchwabNetwork Imp Discl: bit.ly/3JtFGDT
- Tweets 3,467
- Following 200
- Followers 6,525
- Likes 3,547


#RUT #Russell2000
The Average Directional Index (ADX) is known for being a trend-strength gauge.
Peaks and troughs in the ADX can provide meaningful information for trend-followers.
ADX peaks can indicate that trend strength is beginning to wane, making them a potential consideration when evaluating whether to continue holding a trending position...
*Past performance is no guarantee of future results *Schwab does not recommend the use of technical analysis as a sole means of investment research
*All names and market data shown below are for illustrative purposes only and are not a recommendation, offer to sell, or a solicitation of an offer to buy any security
*Chart source: thinkorswim

3
1
17
996
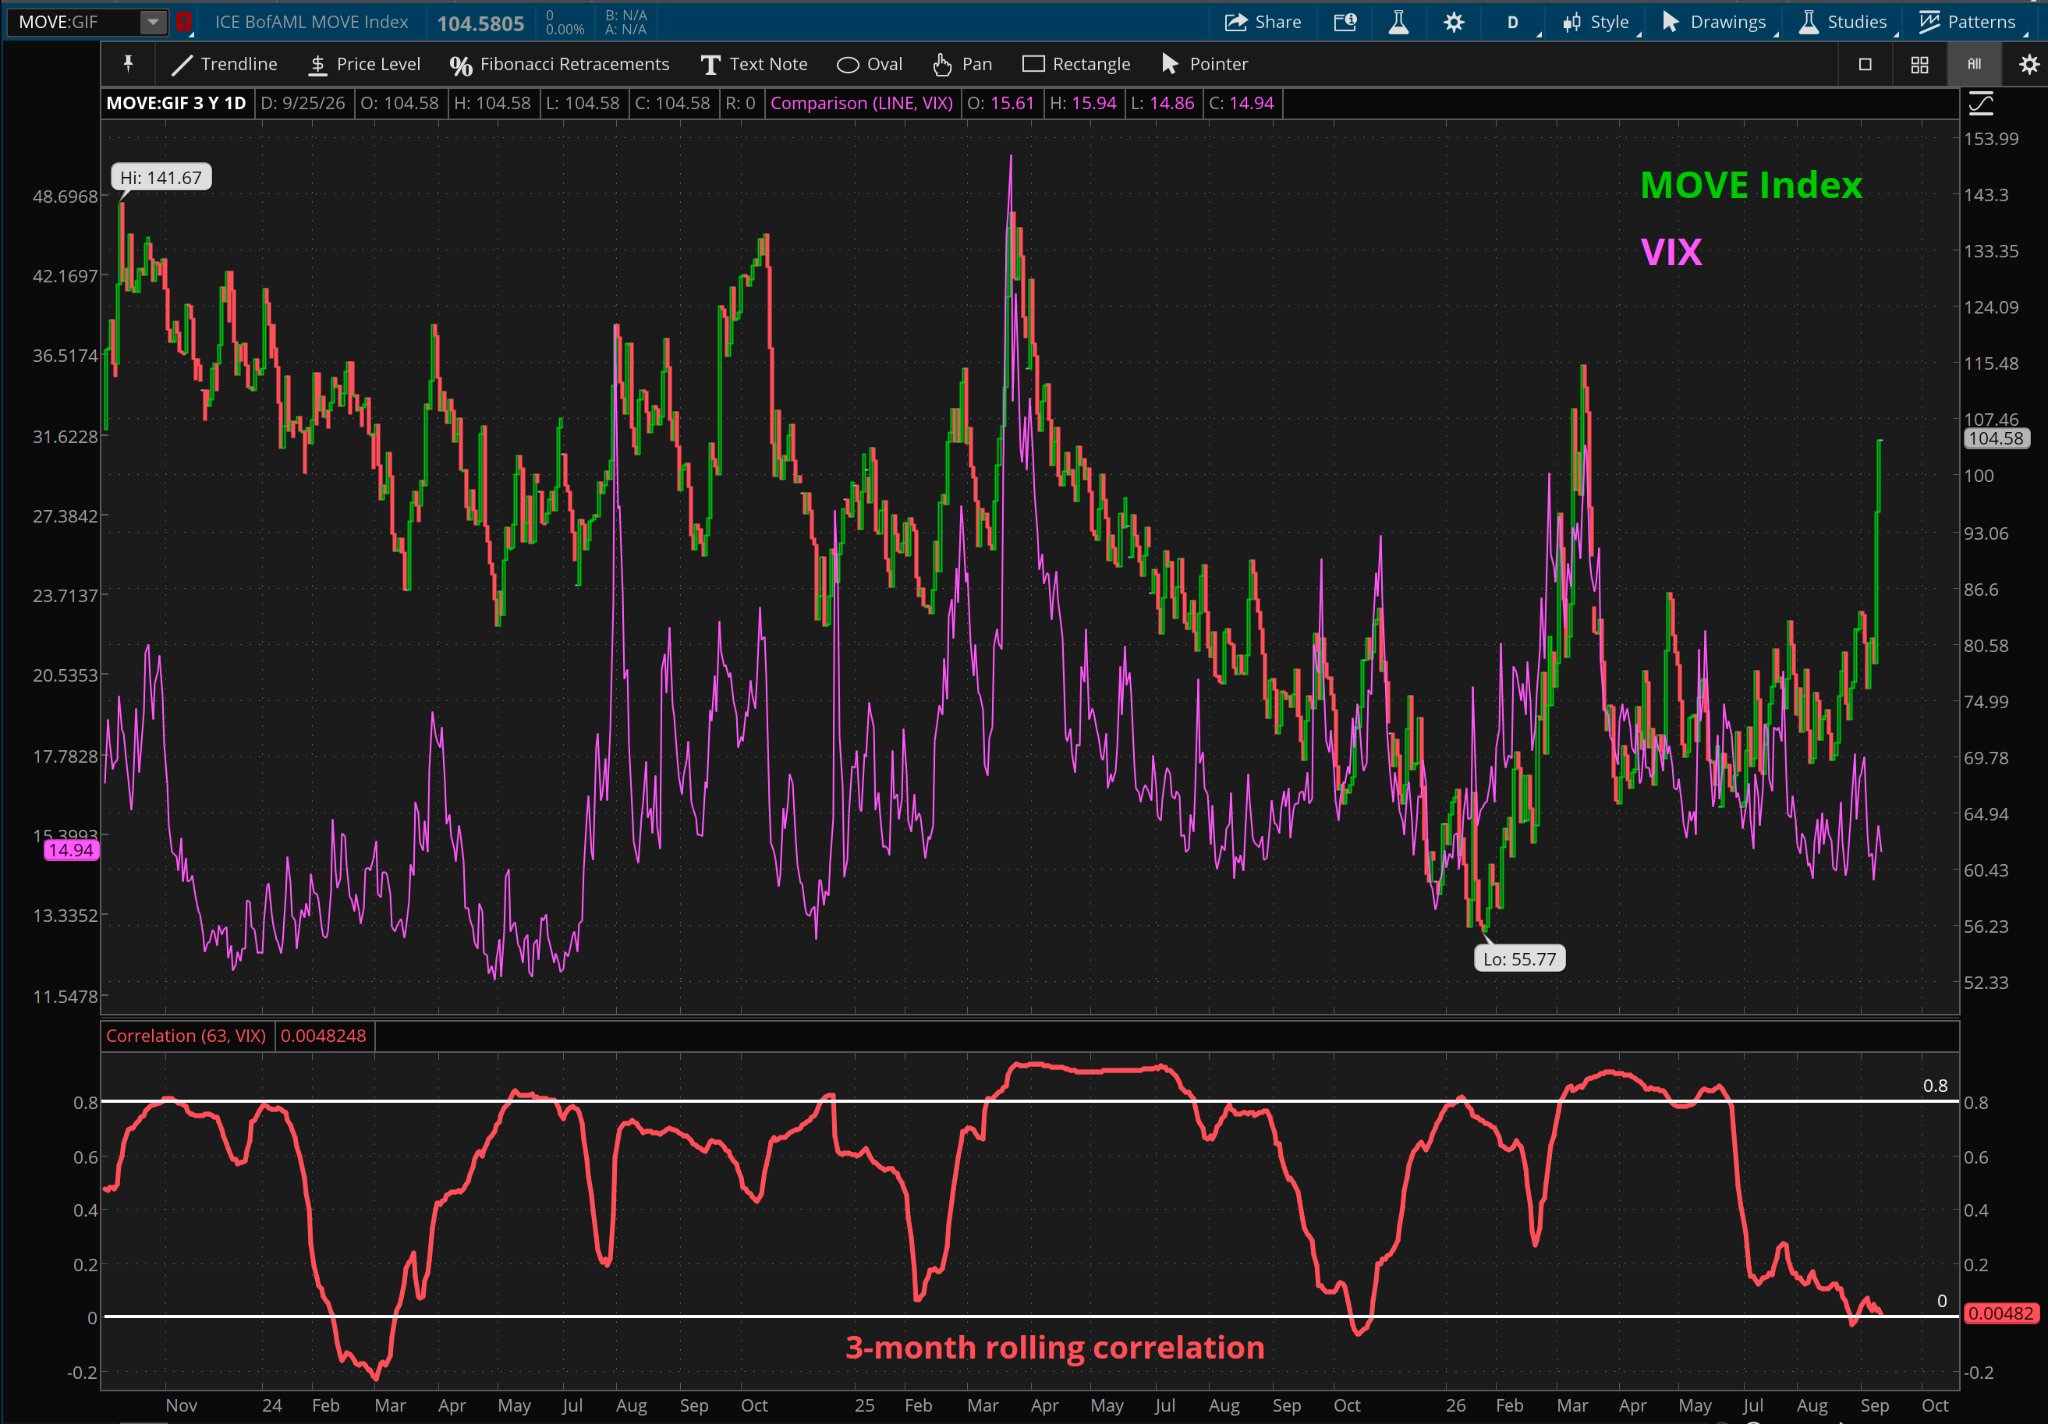
$MOVEIndex and $VIX have reached a near-zero 3-month rolling correlation.
The two volatility measures have become notably decoupled, with bond-market volatility currently moving very differently from equity-market volatility.
Historically, periods of pronounced divergence between the two have eventually been followed by a re-coupling, although the direction and timing are not implied.
The $MOVE Index can sometimes lead $VIX, making the relationship worth watching for signs of a potential shift in equity-market volatility.
*Past performance is no guarantee of future results
*Schwab does not recommend the use of technical analysis as a sole means of investment research
*All names and market data shown below are for illustrative purposes only and are not a recommendation, offer to sell, or a solicitation of an offer to buy any security
*Chart source: thinkorswim
2
3
17
750
The Average Directional Index (ADX) is known for being a trend-strength gauge.
Peaks and troughs in the ADX can provide meaningful information for trend-followers.
ADX peaks can indicate that trend strength is beginning to wane, making them a potential consideration when evaluating whether to continue holding a trending position...
#TNX $TNX
*Past performance is no guarantee of future results
*Schwab does not recommend the use of technical analysis as a sole means of investment research
*All names and market data shown below are for illustrative purposes only and are not a recommendation, offer to sell, or a solicitation of an offer to buy any security
*Chart source: thinkorswim


Bob Farrell once said:
"Parabolic advances usually carry further than you think, but they do not correct by going sideways."
A historical market observation worth keeping in mind... $TNX
*Past performance is no guarantee of future results
*Schwab does not recommend the use of technical analysis as a sole means of investment research
*All names and market data shown below are for illustrative purposes only and are not a recommendation, offer to sell, or a solicitation of an offer to buy any security
*Chart source: thinkorswim

10
842
#HighBeta just broke out to new all-time highs relative to #LowVolatility
However, momentum is diverging, as the MACD is forming a lower high.
Historically, similar momentum divergences have at times accompanied early or failed breakouts.
*Past performance is no guarantee of future results
*Schwab does not recommend the use of technical analysis as a sole means of investment research
*All names and market data shown below are for illustrative purposes only and are not a recommendation, offer to sell, or a solicitation of an offer to buy any security
*Chart source: StockCharts.com

Risk appetite may be knocking on the door.
#HighBeta vs #LowVolatility has expanded higher from a volatility squeeze and is now testing resistance that has defined the upper end of the range for much of the year.
Similar setups in the past were accompanied by periods of relative strength from higher-beta equities.
*Past performance is no guarantee of future results
*Schwab does not recommend the use of technical analysis as a sole means of investment research
*All names and market data shown below are for illustrative purposes only and are not a recommendation, offer to sell, or a solicitation of an offer to buy any security
*Chart source: StockCharts.com

2
12
1,006
Following up on this thread....
$USDJPY has been rejected at polarity (old support now new resistance).
#SmallCaps & #Financials are also pausing at a polarity zone following their nearly simultaneous breaks of support.
Meanwhile, Treasury volatility #MOVEIndex has picked up while equity volatility remains relatively subdued with #VIX < 15.
The divergence between rates volatility and equity volatility is becoming increasingly notable...
Does the bond market move first—or does equity volatility eventually catch up?
*Schwab does not recommend the use of technical analysis as a sole means of investment research
*All names and market data shown below are for illustrative purposes only and are not a recommendation, offer to sell, or a solicitation of an offer to buy any security
*Chart sources: thinkorswim and StockCharts.com


If $USDJPY does break what technicians may deem as resistance of its prior rising channel, market participants may be watching $Smallcaps, $Financials, credit spreads, and the $MOVEIndex for confirmation.
So far, only $RUT and $Financials have broken support.
Meanwhile, credit spreads and the $bond market remain relatively contained, suggesting a mixed message across asset classes.
*Schwab does not recommend the use of technical analysis as a sole means of investment research
*All names and market data shown below are for illustrative purposes only and are not a recommendation, offer to sell, or a solicitation of an offer to buy any security
*Chart source: thinkorswim and StockCharts.com


2
15
1,055
#Silver is coiling near support as Bollinger Bands reach some of their tightest levels of the year.
Technicians may look for a reversion in volatility to accompany a price breakout.
The widest portion of the triangle is roughly $8. Using classical charting techniques, that range can be applied as a potential measured move in either direction.
A confirmed downside break could imply a potential measured move back toward prior lows near $55, while an upside break would imply a move of similar magnitude in the opposite direction.
*Technical patterns are subject to failure and measured objectives are not always met
*Schwab does not recommend the use of technical analysis as a sole means of investment research
*All names and market data shown below are for illustrative purposes only and are not a recommendation, offer to sell, or a solicitation of an offer to buy any security
*Chart source: thinkorswim

2
2
26
1,607
$SPX could be forming a potential inverse head & shoulders formation.
Technicians may keep an eye on neckline resistance near 7780 for potential confirmation of the pattern.
Keep in mind, technical patterns are subject to failure, and confirmation and follow-through would be needed to validate the setup.
*Schwab does not recommend the use of technical analysis as a sole means of investment research
*All names and market data shown below are for illustrative purposes only and are not a recommendation, offer to sell, or a solicitation of an offer to buy any security
*Chart source: thinkorswim

1
1
36
1,434
Charts of the Day:
#DowIndustrials & #DowTransports are both sitting at a polarity zone, which can act as potential support.
$DJT is printing a potential inside day, while $DJIA is printing a potential CAHOLD (Close Above the High of the Low Day).
Both patterns can serve as potential reversal signals, but confirmation and follow-through would be needed to validate the setup.
*Schwab does not recommend the use of technical analysis as a sole means of investment research
*All names and market data shown below are for illustrative purposes only and are not a recommendation, offer to sell, or a solicitation of an offer to buy any security
*Chart source: thinkorswim


1
1
11
893
Thank you for the mention!

“$NatGas has broken above its Anchored VWAP from yearly highs.
Some technicians may be watching to see whether the move is accompanied by above-average volume, which may provide additional confirmation of the breakout. @RachelDashCS
*Schwab does not recommend the use of technical analysis as a sole means of investment research
*All names and market data shown below are for illustrative purposes only and are not a recommendation, offer to sell, or a solicitation of an offer to buy any security
*Chart source: thinkorswim”

2
14
1,129
The #MOVEIndex, a measure for Bond market volatility, just notched the highest 5-day rate of change since March 15, 2023
*Schwab does not recommend the use of technical analysis as a sole means of investment research
*All names and market data shown below are for illustrative purposes only and are not a recommendation, offer to sell, or a solicitation of an offer to buy any security
*Chart source: thinkorswim

2
3
28
1,492


With 10-year Treasury yields on pace for another weekly advance, I looked back at every $TNX streak of 7 or more consecutive weekly higher closes over the past decade.
In the prior occurrences identified, $Yields subsequently experienced multi-month declines.
Following the 2021 streak, yields fell approximately 36%. Following the 2022/23 streak, yields declined approximately 23%.
Historical patterns can provide context, but they do not indicate how the current streak may resolve.
*Past performance is no guarantee of future results
*Schwab does not recommend the use of technical analysis as a sole means of investment research
*All names and market data shown below are for illustrative purposes only and are not a recommendation, offer to sell, or a solicitation of an offer to buy any security
*Chart source: thinkorswim

3
3
37
1,690
Bob Farrell once said:
"Parabolic advances usually carry further than you think, but they do not correct by going sideways."
A historical market observation worth keeping in mind... $TNX
*Past performance is no guarantee of future results
*Schwab does not recommend the use of technical analysis as a sole means of investment research
*All names and market data shown below are for illustrative purposes only and are not a recommendation, offer to sell, or a solicitation of an offer to buy any security
*Chart source: thinkorswim
7
5
57
4,194
$NatGas has broken above its Anchored VWAP from yearly highs.
Some technicians may be watching to see whether the move is accompanied by above-average volume, which may provide additional confirmation of the breakout.
*Schwab does not recommend the use of technical analysis as a sole means of investment research
*All names and market data shown below are for illustrative purposes only and are not a recommendation, offer to sell, or a solicitation of an offer to buy any security
*Chart source: thinkorswim

1
3
25
1,917
$MSTR on various time frames
Daily: Reclaimed the Anchored VWAP (AVWAP) from yearly highs. Some technicians may be watching to see whether price can remain above that level. However, the broader structure still consists of lower highs and lower lows.
Weekly: Some technicians may interpret the recent setup as a failed head-and-shoulders top. The AVWAP from the 5-year lows sits ~188, an area that also aligns closely with the 38.2% Fibonacci retracement on the daily chart. Market participants may be monitoring that zone as a potential area of technical interest.
*Schwab does not recommend the use of technical analysis as a sole means of investment research
*All names and market data shown below are for illustrative purposes only and are not a recommendation, offer to sell, or a solicitation of an offer to buy any security
*Chart source: thinkorswim


1
15
1,126
Commercial hedgers currently hold a sizable net long position in Treasury bond futures, while bond prices remain in a downtrend.
Some market participants may view this divergence as noteworthy, although the price trend itself has not yet shown evidence of a durable bond reversal.
*Schwab does not recommend the use of technical analysis as a sole means of investment research
*All names and market data shown below are for illustrative purposes only and are not a recommendation, offer to sell, or a solicitation of an offer to buy any security
*Chart source: Bloomberg

1
18
1,172
Rachel Dashiell, CFP, CMT retweeted

.@RachelDashCS joins #MorningTradeLive and host @sam_vadas to offer in-depth technical analysis of the markets.
📽️ The Big 🖼️ on @SchwabNetwork nitter.net/i/broadcasts/1dGYlaobE…
2
3
8
2,493