

Trader. Nature Lover. Chart enthusiast. Head of Technical Research & Strategy @SchwabResearch & Contributor @SchwabNetwork Imp Discl: bit.ly/3JtFGDT
Based in United States
- Tweets 3,467
- Following 200
- Followers 6,530
- Likes 3,547

#RUT #Russell2000
The Average Directional Index (ADX) is known for being a trend-strength gauge.
Peaks and troughs in the ADX can provide meaningful information for trend-followers.
ADX peaks can indicate that trend strength is beginning to wane, making them a potential consideration when evaluating whether to continue holding a trending position...
*Past performance is no guarantee of future results *Schwab does not recommend the use of technical analysis as a sole means of investment research
*All names and market data shown below are for illustrative purposes only and are not a recommendation, offer to sell, or a solicitation of an offer to buy any security
*Chart source: thinkorswim

3
1
22
1,189
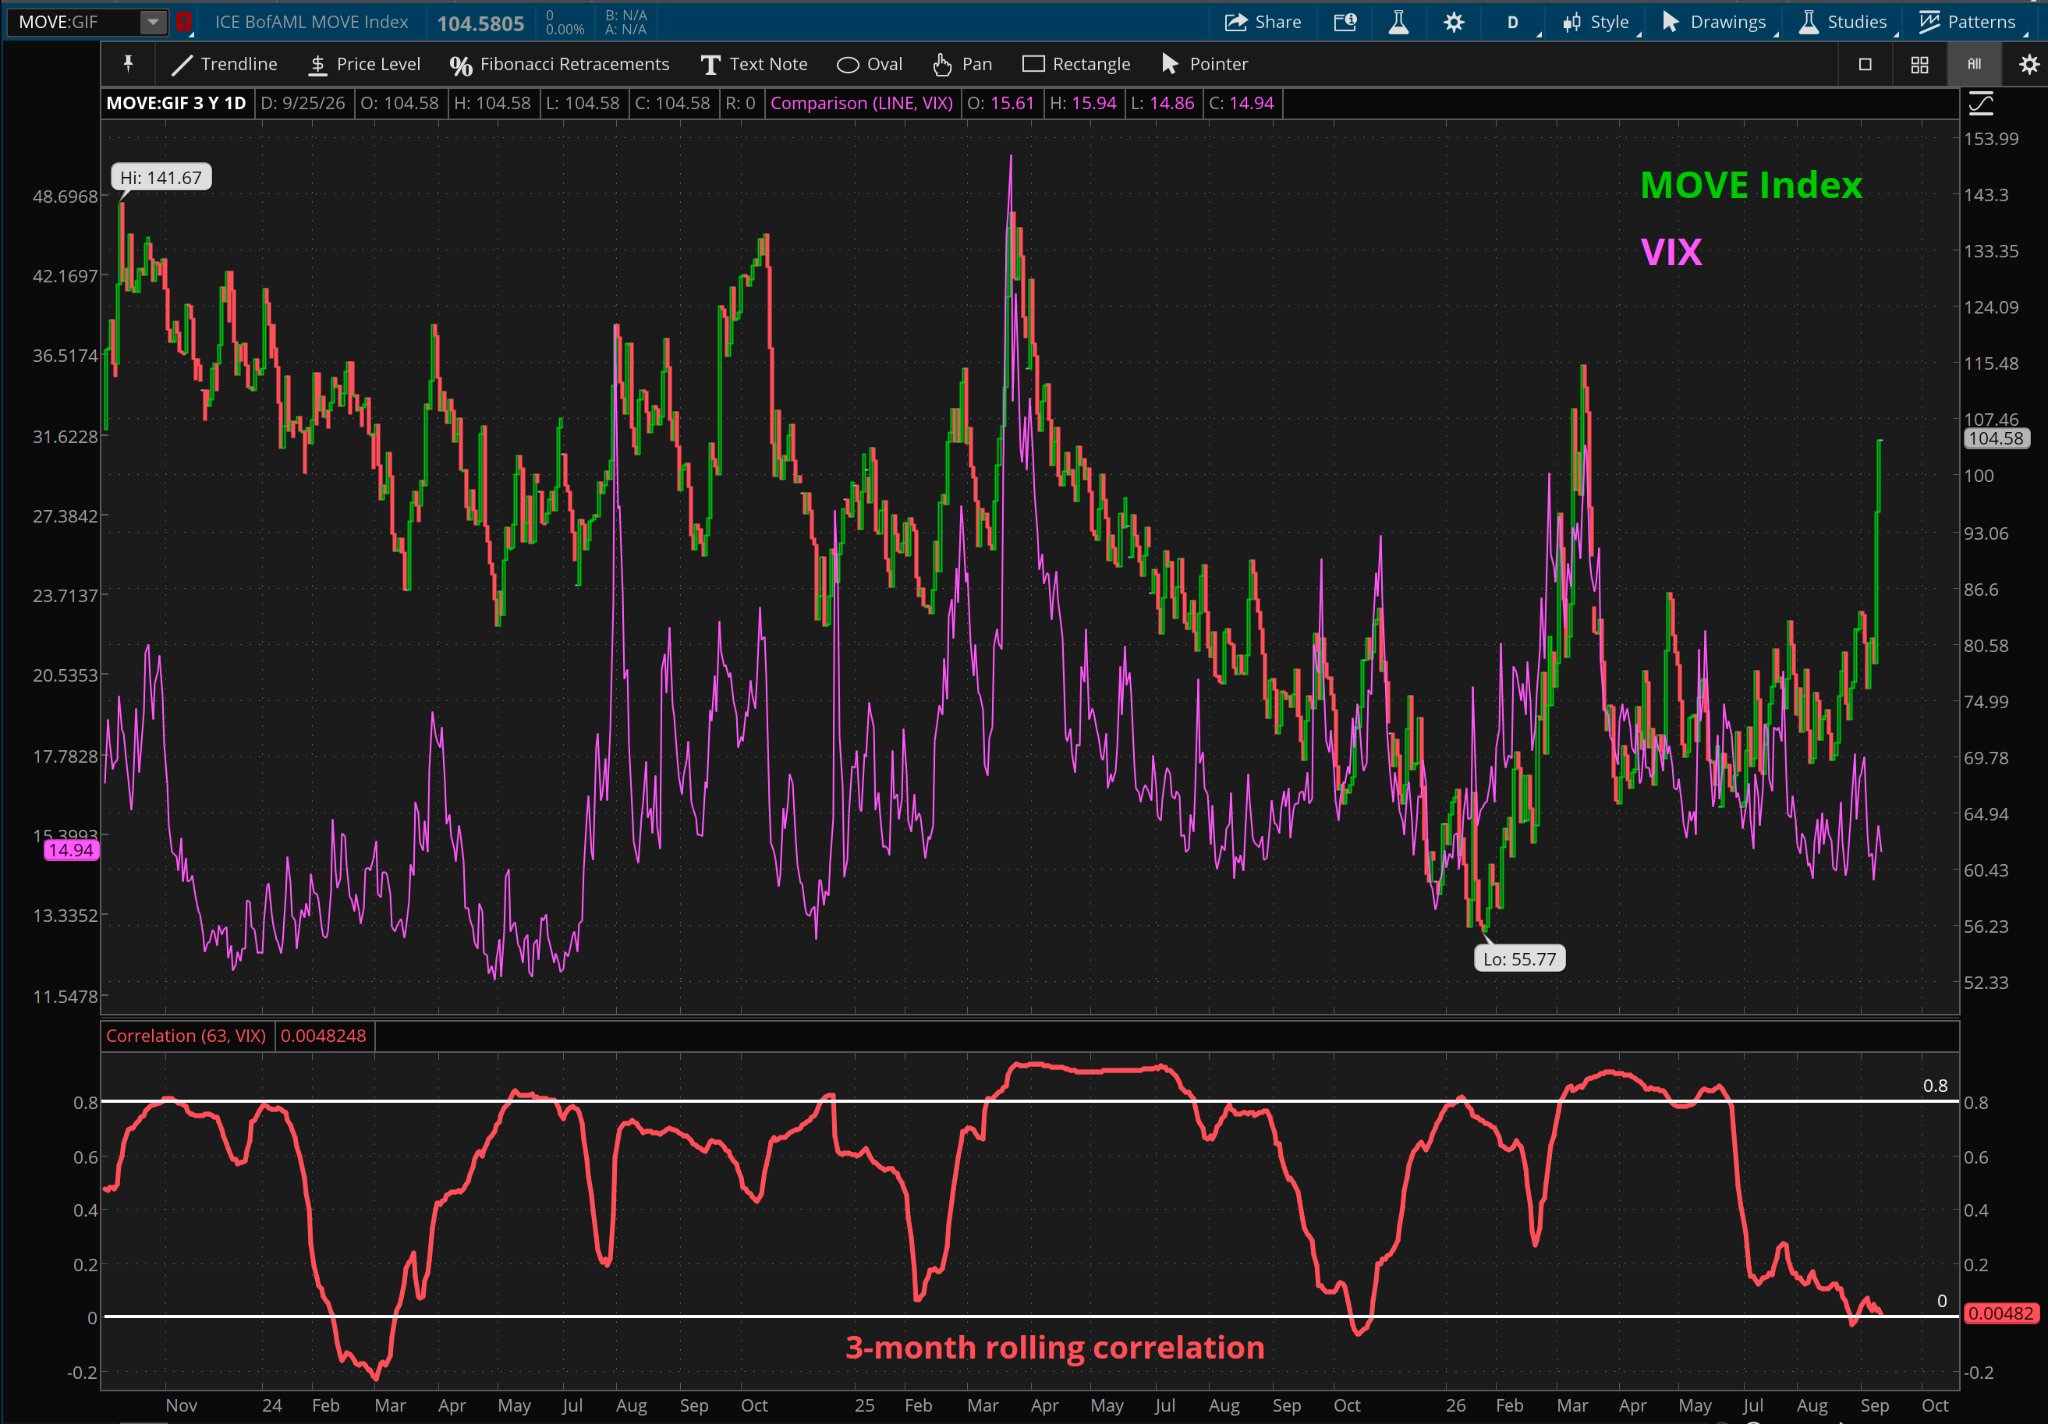
$MOVEIndex and $VIX have reached a near-zero 3-month rolling correlation.
The two volatility measures have become notably decoupled, with bond-market volatility currently moving very differently from equity-market volatility.
Historically, periods of pronounced divergence between the two have eventually been followed by a re-coupling, although the direction and timing are not implied.
The $MOVE Index can sometimes lead $VIX, making the relationship worth watching for signs of a potential shift in equity-market volatility.
*Past performance is no guarantee of future results
*Schwab does not recommend the use of technical analysis as a sole means of investment research
*All names and market data shown below are for illustrative purposes only and are not a recommendation, offer to sell, or a solicitation of an offer to buy any security
*Chart source: thinkorswim
2
3
20
951
The Average Directional Index (ADX) is known for being a trend-strength gauge.
Peaks and troughs in the ADX can provide meaningful information for trend-followers.
ADX peaks can indicate that trend strength is beginning to wane, making them a potential consideration when evaluating whether to continue holding a trending position...
#TNX $TNX
*Past performance is no guarantee of future results
*Schwab does not recommend the use of technical analysis as a sole means of investment research
*All names and market data shown below are for illustrative purposes only and are not a recommendation, offer to sell, or a solicitation of an offer to buy any security
*Chart source: thinkorswim


Bob Farrell once said:
"Parabolic advances usually carry further than you think, but they do not correct by going sideways."
A historical market observation worth keeping in mind... $TNX
*Past performance is no guarantee of future results
*Schwab does not recommend the use of technical analysis as a sole means of investment research
*All names and market data shown below are for illustrative purposes only and are not a recommendation, offer to sell, or a solicitation of an offer to buy any security
*Chart source: thinkorswim

10
954
#HighBeta just broke out to new all-time highs relative to #LowVolatility
However, momentum is diverging, as the MACD is forming a lower high.
Historically, similar momentum divergences have at times accompanied early or failed breakouts.
*Past performance is no guarantee of future results
*Schwab does not recommend the use of technical analysis as a sole means of investment research
*All names and market data shown below are for illustrative purposes only and are not a recommendation, offer to sell, or a solicitation of an offer to buy any security
*Chart source: StockCharts.com

Risk appetite may be knocking on the door.
#HighBeta vs #LowVolatility has expanded higher from a volatility squeeze and is now testing resistance that has defined the upper end of the range for much of the year.
Similar setups in the past were accompanied by periods of relative strength from higher-beta equities.
*Past performance is no guarantee of future results
*Schwab does not recommend the use of technical analysis as a sole means of investment research
*All names and market data shown below are for illustrative purposes only and are not a recommendation, offer to sell, or a solicitation of an offer to buy any security
*Chart source: StockCharts.com

2
14
1,116
Following up on this thread....
$USDJPY has been rejected at polarity (old support now new resistance).
#SmallCaps & #Financials are also pausing at a polarity zone following their nearly simultaneous breaks of support.
Meanwhile, Treasury volatility #MOVEIndex has picked up while equity volatility remains relatively subdued with #VIX < 15.
The divergence between rates volatility and equity volatility is becoming increasingly notable...
Does the bond market move first—or does equity volatility eventually catch up?
*Schwab does not recommend the use of technical analysis as a sole means of investment research
*All names and market data shown below are for illustrative purposes only and are not a recommendation, offer to sell, or a solicitation of an offer to buy any security
*Chart sources: thinkorswim and StockCharts.com


If $USDJPY does break what technicians may deem as resistance of its prior rising channel, market participants may be watching $Smallcaps, $Financials, credit spreads, and the $MOVEIndex for confirmation.
So far, only $RUT and $Financials have broken support.
Meanwhile, credit spreads and the $bond market remain relatively contained, suggesting a mixed message across asset classes.
*Schwab does not recommend the use of technical analysis as a sole means of investment research
*All names and market data shown below are for illustrative purposes only and are not a recommendation, offer to sell, or a solicitation of an offer to buy any security
*Chart source: thinkorswim and StockCharts.com


2
16
1,197
#Silver is coiling near support as Bollinger Bands reach some of their tightest levels of the year.
Technicians may look for a reversion in volatility to accompany a price breakout.
The widest portion of the triangle is roughly $8. Using classical charting techniques, that range can be applied as a potential measured move in either direction.
A confirmed downside break could imply a potential measured move back toward prior lows near $55, while an upside break would imply a move of similar magnitude in the opposite direction.
*Technical patterns are subject to failure and measured objectives are not always met
*Schwab does not recommend the use of technical analysis as a sole means of investment research
*All names and market data shown below are for illustrative purposes only and are not a recommendation, offer to sell, or a solicitation of an offer to buy any security
*Chart source: thinkorswim

3
3
32
2,070
$SPX could be forming a potential inverse head & shoulders formation.
Technicians may keep an eye on neckline resistance near 7780 for potential confirmation of the pattern.
Keep in mind, technical patterns are subject to failure, and confirmation and follow-through would be needed to validate the setup.
*Schwab does not recommend the use of technical analysis as a sole means of investment research
*All names and market data shown below are for illustrative purposes only and are not a recommendation, offer to sell, or a solicitation of an offer to buy any security
*Chart source: thinkorswim

1
3
39
1,620
Charts of the Day:
#DowIndustrials & #DowTransports are both sitting at a polarity zone, which can act as potential support.
$DJT is printing a potential inside day, while $DJIA is printing a potential CAHOLD (Close Above the High of the Low Day).
Both patterns can serve as potential reversal signals, but confirmation and follow-through would be needed to validate the setup.
*Schwab does not recommend the use of technical analysis as a sole means of investment research
*All names and market data shown below are for illustrative purposes only and are not a recommendation, offer to sell, or a solicitation of an offer to buy any security
*Chart source: thinkorswim


1
1
11
951
The #MOVEIndex, a measure for Bond market volatility, just notched the highest 5-day rate of change since March 15, 2023
*Schwab does not recommend the use of technical analysis as a sole means of investment research
*All names and market data shown below are for illustrative purposes only and are not a recommendation, offer to sell, or a solicitation of an offer to buy any security
*Chart source: thinkorswim

2
3
28
1,510
With 10-year Treasury yields on pace for another weekly advance, I looked back at every $TNX streak of 7 or more consecutive weekly higher closes over the past decade.
In the prior occurrences identified, $Yields subsequently experienced multi-month declines.
Following the 2021 streak, yields fell approximately 36%. Following the 2022/23 streak, yields declined approximately 23%.
Historical patterns can provide context, but they do not indicate how the current streak may resolve.
*Past performance is no guarantee of future results
*Schwab does not recommend the use of technical analysis as a sole means of investment research
*All names and market data shown below are for illustrative purposes only and are not a recommendation, offer to sell, or a solicitation of an offer to buy any security
*Chart source: thinkorswim

3
3
37
1,699
Bob Farrell once said:
"Parabolic advances usually carry further than you think, but they do not correct by going sideways."
A historical market observation worth keeping in mind... $TNX
*Past performance is no guarantee of future results
*Schwab does not recommend the use of technical analysis as a sole means of investment research
*All names and market data shown below are for illustrative purposes only and are not a recommendation, offer to sell, or a solicitation of an offer to buy any security
*Chart source: thinkorswim
7
5
57
4,291
$NatGas has broken above its Anchored VWAP from yearly highs.
Some technicians may be watching to see whether the move is accompanied by above-average volume, which may provide additional confirmation of the breakout.
*Schwab does not recommend the use of technical analysis as a sole means of investment research
*All names and market data shown below are for illustrative purposes only and are not a recommendation, offer to sell, or a solicitation of an offer to buy any security
*Chart source: thinkorswim

1
3
25
1,920
$MSTR on various time frames
Daily: Reclaimed the Anchored VWAP (AVWAP) from yearly highs. Some technicians may be watching to see whether price can remain above that level. However, the broader structure still consists of lower highs and lower lows.
Weekly: Some technicians may interpret the recent setup as a failed head-and-shoulders top. The AVWAP from the 5-year lows sits ~188, an area that also aligns closely with the 38.2% Fibonacci retracement on the daily chart. Market participants may be monitoring that zone as a potential area of technical interest.
*Schwab does not recommend the use of technical analysis as a sole means of investment research
*All names and market data shown below are for illustrative purposes only and are not a recommendation, offer to sell, or a solicitation of an offer to buy any security
*Chart source: thinkorswim


1
15
1,132
Commercial hedgers currently hold a sizable net long position in Treasury bond futures, while bond prices remain in a downtrend.
Some market participants may view this divergence as noteworthy, although the price trend itself has not yet shown evidence of a durable bond reversal.
*Schwab does not recommend the use of technical analysis as a sole means of investment research
*All names and market data shown below are for illustrative purposes only and are not a recommendation, offer to sell, or a solicitation of an offer to buy any security
*Chart source: Bloomberg

1
18
1,174
$CrudeOil back to a key test.
The Anchored VWAP from yearly highs and the 38.2% Fibonacci retracement converge near current levels.
Technicians may be watching for a CAHOLD (Close Above the High of the Low Day) near 93.84 as a potential confirmation signal.
*Schwab does not recommend the use of technical analysis as a sole means of investment research
*All names and market data shown below are for illustrative purposes only and are not a recommendation, offer to sell, or a solicitation of an offer to buy any security
*Chart source: thinkorswim

2
1
21
1,290
Chart of the day:
Based on $SPX 50-year average annual returns, the calendar is approaching an area that has historically marked a seasonal low before a stronger finish to the year.
*Past performance is no guarantee of future results
*Schwab does not recommend the use of technical analysis as a sole means of investment research
*All names and market data shown below are for illustrative purposes only and are not a recommendation, offer to sell, or a solicitation of an offer to buy any security
*Chart source: thinkorswim

3
4
59
2,095
#SPX back to the scene of the crime...
Price is retesting the upper boundary of its prior descending channel. Some market participants may view the pullback as a test of whether the breakout level can hold as support.
*Schwab does not recommend the use of technical analysis as a sole means of investment research
*All names and market data shown below are for illustrative purposes only and are not a recommendation, offer to sell, or a solicitation of an offer to buy any security
*Chart source: thinkorswim

7
2
58
2,656
This is one of those examples of how, when information changes, so does the need to adapt your view.
Positioning is shifting in the #USDollar $DXY
Commercial hedgers are reducing short exposure while large speculators are reducing long exposure.
Meanwhile, the #DollarIndex has moved above 100.5 resistance.
Some market participants may interpret that development as supportive of a more constructive, bullish technical backdrop for the dollar, although continued follow-through and support retention may be monitored for confirmation.
*Schwab does not recommend the use of technical analysis as a sole means of investment research
*All names and market data shown below are for illustrative purposes only and are not a recommendation, offer to sell, or a solicitation of an offer to buy any security
*Chart source: Bloomberg

Another interesting thing I'm monitoring is positioning in $USDollar futures alongside confirmation signals from the $Euro.
Commercial hedgers are near some of their most net-short readings in the Dollar as $DXY approaches potential resistance near 100.5.
Meanwhile, the move in the $USDollarIndex is not being fully confirmed by $EURUSD, which remains above an area some technicians may view as key support.
Divergences like these can sometimes be resolved by the stronger market reversing course. If $DXY fails to hold above recent breakout levels, market participants may be watching whether equities and commodities respond favorably.
*Schwab does not recommend the use of technical analysis as a sole means of investment research
*All names and market data shown below are for illustrative purposes only and are not a recommendation, offer to sell, or a solicitation of an offer to buy any security
*Chart sources: thinkorswim and Bloomberg


2
31
1,924
The rolling 3-month correlation between #CrudeOil prices and #TNX 10-Year Treasury Yields has reached a 3-year extreme of +0.90.
Historically, correlations can fluctuate as market conditions evolve. While elevated readings have not always persisted indefinitely, past relationships are not necessarily indicative of future results.
Technicians and intermarket analysts may be monitoring whether this unusually strong relationship persists or begins to weaken.
*Schwab does not recommend the use of technical analysis as a sole means of investment research
*All names and market data shown below are for illustrative purposes only and are not a recommendation, offer to sell, or a solicitation of an offer to buy any security
*Chart source: thinkorswim

2
22
1,277
$DXY is testing the 50% midpoint of a prior fair value gap ~100.88.
The index has traded above the level intraday, but technicians may be looking for a decisive close above the zone, followed by evidence that former resistance is transitioning into support, before adopting a more bullish technical bias.
*Schwab does not recommend the use of technical analysis as a sole means of investment research
*All names and market data shown below are for illustrative purposes only and are not a recommendation, offer to sell, or a solicitation of an offer to buy any security
*Chart source: Bloomberg

Another interesting thing I'm monitoring is positioning in $USDollar futures alongside confirmation signals from the $Euro.
Commercial hedgers are near some of their most net-short readings in the Dollar as $DXY approaches potential resistance near 100.5.
Meanwhile, the move in the $USDollarIndex is not being fully confirmed by $EURUSD, which remains above an area some technicians may view as key support.
Divergences like these can sometimes be resolved by the stronger market reversing course. If $DXY fails to hold above recent breakout levels, market participants may be watching whether equities and commodities respond favorably.
*Schwab does not recommend the use of technical analysis as a sole means of investment research
*All names and market data shown below are for illustrative purposes only and are not a recommendation, offer to sell, or a solicitation of an offer to buy any security
*Chart sources: thinkorswim and Bloomberg
2
1
21
1,759
The #Energy sector tested a confluence of potential support yesterday consisting of prior highs and the rising 50 DMA.
The session formed a Doji candlestick, which some technicians interpret as a sign of indecision.
Traders may now be watching for follow-through. One confirmation signal some market participants use is a CAHOLD (Close Above the High Of the Low Day) near this support zone.
Meanwhile, Bollinger Bandwidth has compressed toward some of the lowest levels of the year. Because volatility tends to alternate between contraction and expansion, technicians may be watching to see whether the next volatility expansion accompanies a breakout higher or lower from the current range.
*Schwab does not recommend the use of technical analysis as a sole means of investment research
*All names and market data shown below are for illustrative purposes only and are not a recommendation, offer to sell, or a solicitation of an offer to buy any security
*Chart source: thinkorswim

1
26
1,156
Join @PatrickCiummoCS and I again today at 1pm ET for our "Trading Price Patterns" webcast on #SchwabCoaching
Last week, we paper traded the fractal double bottom breakout in $ZS
In previous weeks, we also (example) traded the bullish engulfing monthly support bounce at the 61.8% Fib in $IAG as well as the CAHOLD (Close Above the High of the Low Day) at support in $NEM
We will be reviewing these past simulated trades, adjusting stops, and placing new ones!
piped.video/watch?v=nFsBxA_v…
*Schwab does not recommend the use of technical analysis as a sole means of investment research
*All names and market data shown below are for illustrative purposes only and are not a recommendation, offer to sell, or a solicitation of an offer to buy any security
*Chart source: thinkorswim


1
18
1,133
Chart of the day: $Discretionary
This long-term potential diamond formation taking shape above prior cycle highs in the #ConsumerDiscretionary sector has my attention.
Technicians may be watching the converging trendlines closely. A decisive move beyond either boundary could provide additional information about the sector's longer-term trend.
Keep in mind all patterns may be subject to failure.
*Schwab does not recommend the use of technical analysis as a sole means of investment research
*All names and market data shown below are for illustrative purposes only and are not a recommendation, offer to sell, or a solicitation of an offer to buy any security
*Chart source: thinkorswim

1
2
35
1,438
#Healthcare appears to be testing the lower boundary of its August gap zone after a possible failed breakdown beneath support.
Technicians may be watching to see whether price can reclaim the gap area, which could begin to challenge the bearish implications of the island reversal.
*Schwab does not recommend the use of technical analysis as a sole means of investment research
*All names and market data shown below are for illustrative purposes only and are not a recommendation, offer to sell, or a solicitation of an offer to buy any security
*Chart source: thinkorswim

1
25
1,053
#SPX & #NDX futures have broken to new highs. But trend structure isn't just about higher highs...
Technicians may also be watching for the next pullback to form a higher low.
The recent breakout zones may be key areas of interest should prices retrace:
S&P 500 futures: ~7782.5
Nasdaq 100 futures: ~30343
*Schwab does not recommend the use of technical analysis as a sole means of investment research
*All names and market data shown below are for illustrative purposes only and are not a recommendation, offer to sell, or a solicitation of an offer to buy any security
*Chart source: thinkorswim


2
25
1,363
Risk appetite may be knocking on the door.
#HighBeta vs #LowVolatility has expanded higher from a volatility squeeze and is now testing resistance that has defined the upper end of the range for much of the year.
Similar setups in the past were accompanied by periods of relative strength from higher-beta equities.
*Past performance is no guarantee of future results
*Schwab does not recommend the use of technical analysis as a sole means of investment research
*All names and market data shown below are for illustrative purposes only and are not a recommendation, offer to sell, or a solicitation of an offer to buy any security
*Chart source: StockCharts.com
15
1,608
$WBD potential long-term cup & handle formation
*Schwab does not recommend the use of technical analysis as a sole means of investment research
*All names and market data shown below are for illustrative purposes only and are not a recommendation, offer to sell, or a solicitation of an offer to buy any security
*Chart source: thinkorswim

1
9
999
#CommunicationServices
*Schwab does not recommend the use of technical analysis as a sole means of investment research
*All names and market data shown below are for illustrative purposes only and are not a recommendation, offer to sell, or a solicitation of an offer to buy any security
*Chart source: thinkorswim

2
18
1,268
$OEX S&P 100 Index:
An example of the effects of a "bear trap."
Last week's breakdown below support was quickly rejected, and price has since surged into new highs.
In technical analysis, failed moves can sometimes result in fast moves in the opposite direction.
*Past performance is no guarantee of future results
*Schwab does not recommend the use of technical analysis as a sole means of investment research
*All names and market data shown below are for illustrative purposes only and are not a recommendation, offer to sell, or a solicitation of an offer to buy any security
*Chart source: thinkorswim

2
14
949
$RUT #Russell2000 Small-cap futures briefly broke below support before reversing back to the prior trading range.
Technicians sometimes refer to this type of action as a potential "bear trap" or failed breakdown.
Confirmation may depend on whether prices can continue to hold above the reclaimed support zone in the days ahead.
*Schwab does not recommend the use of technical analysis as a sole means of investment research
*All names and market data shown below are for illustrative purposes only and are not a recommendation, offer to sell, or a solicitation of an offer to buy any security
*Chart source: thinkorswim

3
27
1,299
$Silver relative to $Gold is testing potential falling wedge resistance while sitting near a long-term support zone.
Technicians may be watching closely to see whether the ratio can break above the upper trendline.
Some market participants monitor this relationship as a gauge of risk appetite, as periods of silver outperformance have occasionally coincided with greater investor interest in cyclical and growth-oriented assets.
*Past performance is no guarantee of future resolts
*Schwab does not recommend the use of technical analysis as a sole means of investment research
*All names and market data shown below are for illustrative purposes only and are not a recommendation, offer to sell, or a solicitation of an offer to buy any security
*Chart source: thinkorswim

4
2
40
9,714
Another sentiment indicator: $Gold vs $Silver
schwab.com/learn/story/using…
*Schwab does not recommend the use of technical analysis as a sole means of investment research
*All names and market data shown below are for illustrative purposes only and are not a recommendation, offer to sell, or a solicitation of an offer to buy any security
*Chart source: thinkorswim

1
3
19
1,223
Charts of the day:
Breadth within the context of leadership and rotation matters.
Yes, leadership is narrow with less than 50% of #SPX stocks above their 200 DMAs.
However, #Staples, #Utilities, and other defensive or late cycle groups are hitting relative lows vs the overall index...
#Technology, which has nearly a 40% weight in the index is breaking out to new relative 3-month highs.
*Schwab does not recommend the use of technical analysis as a sole means of investment research
*All names and market data shown below are for illustrative purposes only and are not a recommendation, offer to sell, or a solicitation of an offer to buy any security
*Chart source: thinkorswim


4
4
42
9,932
$Bonds vs $CRBIndex
Worth watching, in my opinion.
*Schwab does not recommend the use of technical analysis as a sole means of investment research
*All names and market data shown below are for illustrative purposes only and are not a recommendation, offer to sell, or a solicitation of an offer to buy any security
*Chart source: StockCharts.com

1
1
14
1,184
$SPCX Three consecutive weekly closes above the 38.2% Fibonacci retracement level, which some technicians may view as evidence that former resistance could begin acting as support (referred to in #SchwabCoaching as the "@KevinHornerCS Rule").
Implied volatility is nearing historic lows for #SPCX.
As volatility is often considered a mean-reverting instrument, some market participants monitor unusually low volatility environments for signs of a future expansion in volatility, which may occur alongside a significant price move higher or lower.
*Schwab does not recommend the use of technical analysis as a sole means of investment research
*All names and market data shown below are for illustrative purposes only and are not a recommendation, offer to sell, or a solicitation of an offer to buy any security
*Chart source: thinkorswim

1
2
32
2,011
$FSLY a coil right beneath the AVWAP from ATHs
*Schwab does not recommend the use of technical analysis as a sole means of investment research
*All names and market data shown below are for illustrative purposes only and are not a recommendation, offer to sell, or a solicitation of an offer to buy any security
*Chart source: thinkorswim

5
1
46
2,119
$COIN $MSTR
*Schwab does not recommend the use of technical analysis as a sole means of investment research
*All names and market data shown below are for illustrative purposes only and are not a recommendation, offer to sell, or a solicitation of an offer to buy any security
*Chart source: thinkorswim


1
19
1,844
$SPX today's price action gapped above the 61.8% Fibonacci retracement from the entire last month's decline.
Some technicians may interpret this as evidence that the recent corrective phase has run its course, with the longer-term uptrend potentially reasserting itself.
*Schwab does not recommend the use of technical analysis as a sole means of investment research
*All names and market data shown below are for illustrative purposes only and are not a recommendation, offer to sell, or a solicitation of an offer to buy any security
*Chart source: thinkorswim

1
22
1,710
$Growth vs $Value digging in where it matters
*Schwab does not recommend the use of technical analysis as a sole means of investment research
*All names and market data shown below are for illustrative purposes only and are not a recommendation, offer to sell, or a solicitation of an offer to buy any security
*Chart source: thinkorswim

Russell 1000 $Growth vs Russell 1000 $Value
Long-term relative strength support line break - it broke down last week on the daily, now on the weekly (let's see where this week closes)...
$Value outperformance - a major shift for 2026 - participation is broadening & leadership regimes are changing
@SchwabTrading @SchwabNetwork
*Not a recommendation

21
1,835
Reversion from oversold in the McClellan Oscillator today $SPX
*Schwab does not recommend the use of technical analysis as a sole means of investment research
*All names and market data shown below are for illustrative purposes only and are not a recommendation, offer to sell, or a solicitation of an offer to buy any security
*Chart source: thinkorswim

The McClellan Oscillator measures the difference between a 19-day EMA minus a 39-day EMA of net $NYSE advancers.
-100 and 100 typically act as oversold & overbought indicators, respectively.
Historically, reversals from deeply oversold readings have occurred around periods when $SPX was establishing market lows.
*Past performance is no guarantee of future results *Schwab does not recommend the use of technical analysis as a sole means of investment research
*All names and market data shown below are for illustrative purposes only and are not a recommendation, offer to sell, or a solicitation of an offer to buy any security
*Chart source: thinkorswim

2
28
1,888
Zooming in:
$CrudeOil broke below prior support near 93, a level that some technicians may now watch as potential resistance.
To the downside, the 61.8% Fibonacci retracement at the July 24 gap near $87 may represent an area of interest that some market participants could view as potential support.
*Schwab does not recommend the use of technical analysis as a sole means of investment research
*All names and market data shown below are for illustrative purposes only and are not a recommendation, offer to sell, or a solicitation of an offer to buy any security
*Chart source: thinkorswim

1
13
1,441
$TNX Knock, knock, anybody home?
*Schwab does not recommend the use of technical analysis as a sole means of investment research
*All names and market data shown below are for illustrative purposes only and are not a recommendation, offer to sell, or a solicitation of an offer to buy any security
*Chart source: thinkorswim

10
1,074